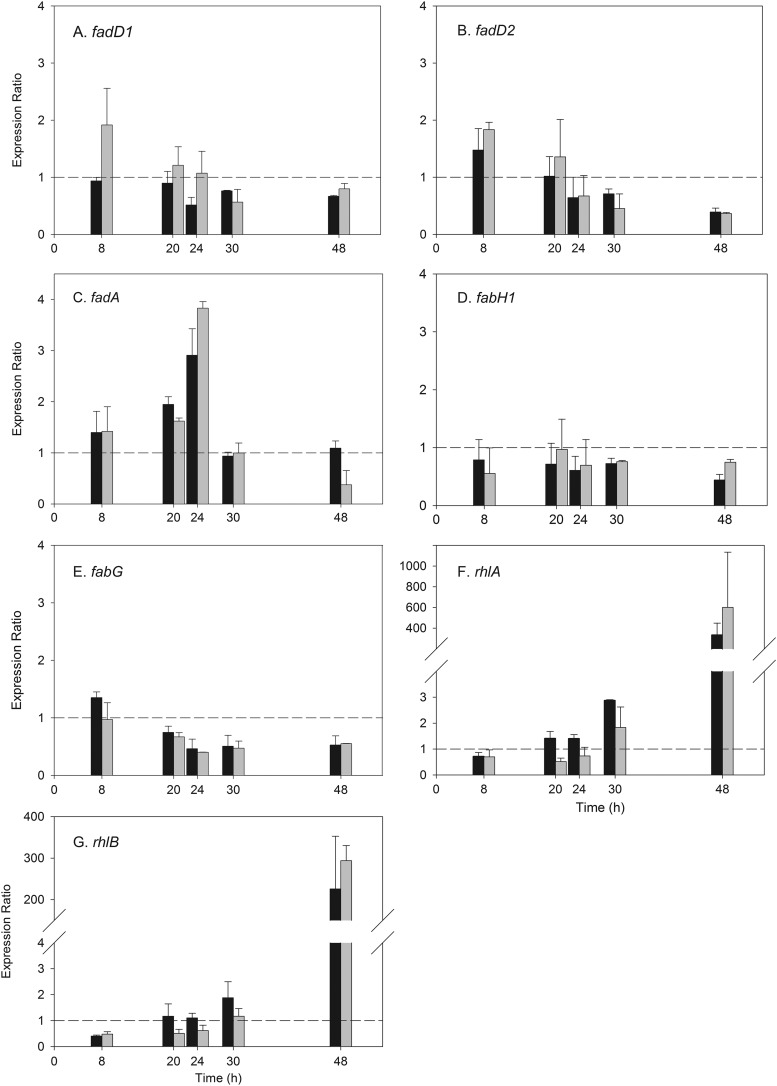
Fig 6.
Relative expression ratios of the target genes fadD1 (A), fadD2 (B), fadA (C), fabH1 (D), fabG (E), rhlA (F), and rhlB (G) at 8, 20, 24, 30, and 48 h. The control was glucose alone, and the two treatments were glucose plus octadecanoic acid (black bars) and glucose plus octadecanoic acid-d35 (gray bars). The dashed line shows an expression ratio of 1, which indicates that the effect of octadecanoic acid or octadecanoic acid-d35 on the target gene was equal to the effect on the reference genes.

