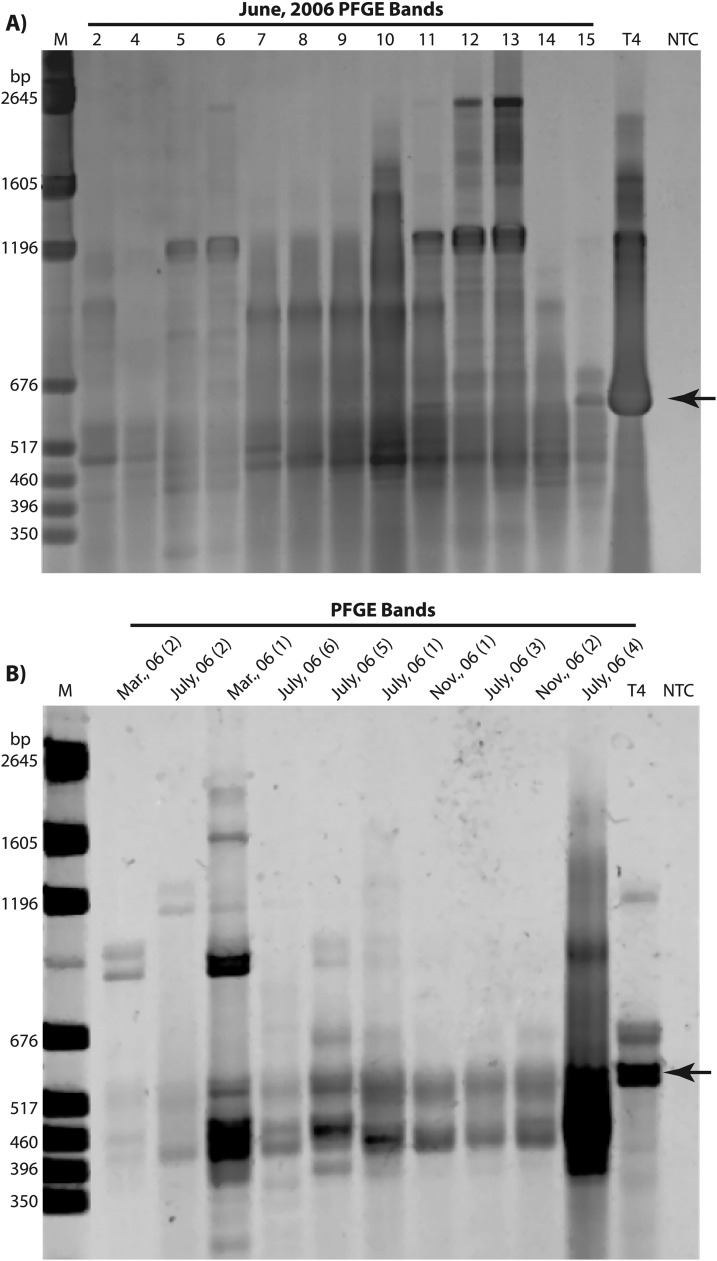
Fig 2.
Amplification of g23 T4-like major capsid protein from single PFGE bands. (A) g23 amplicons from June 2006 PFGE bands. Numbers above lanes correspond to numbered PFGE bands in Fig. 1. (B) g23 amplicons from various PFGE bands. Lane designations are the month and year of sample collection, with numbers in parentheses corresponding to numbered PFGE bands in Fig. 1. Lanes labeled T4 were g23 amplicons from phage T4 genomic DNA. Marker lane M (in base pairs) indicates pGEM DNA. NTC, no template control. Arrow indicates the g23 amplicon from T4 genomic DNA. Amplification products from 480 bp to 600 bp were cut out and sequenced. A detailed description of bands purified and sequenced is summarized in Table S1 in the supplemental material.

