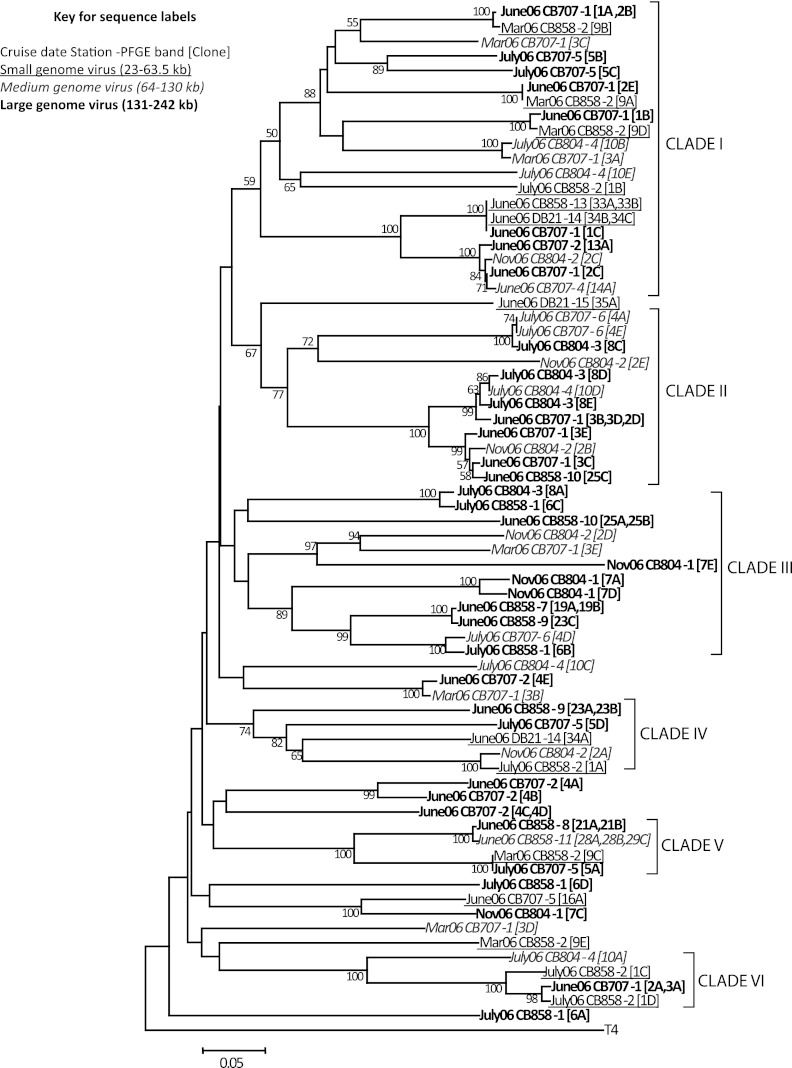
Fig 3.
Neighbor-joining tree of g23 amino acid sequences from Chesapeake and Delaware Bay water samples. The tree is based on alignment of 178 homologous amino acid positions. The scale bar represents the number of amino acid substitutions per residue. The phage T4 g23 sequence was used as an outgroup. The values at each node indicate the bootstrap values above 50 using 500 replicates.

