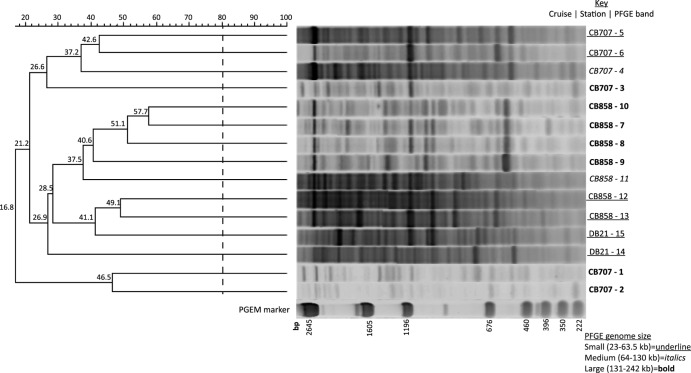
Fig 4.
Dendrogram of RAPD-PCR profiles from June 2006 PFGE band DNA. Viral concentrates were collected across three stations (CB858, CB707, DB21) in the Chesapeake and Delaware Bays. Numbers adjacent to sample names denote the PFGE band number shown in the June 2006 gel in Fig. 1. Percentage similarities of banding patterns are shown on the scale above the dendrogram and at the nodes. Size of marker band (pGEM) is given in base pairs of DNA. Fingerprints with greater than 80% similarity in banding pattern were considered identical.

