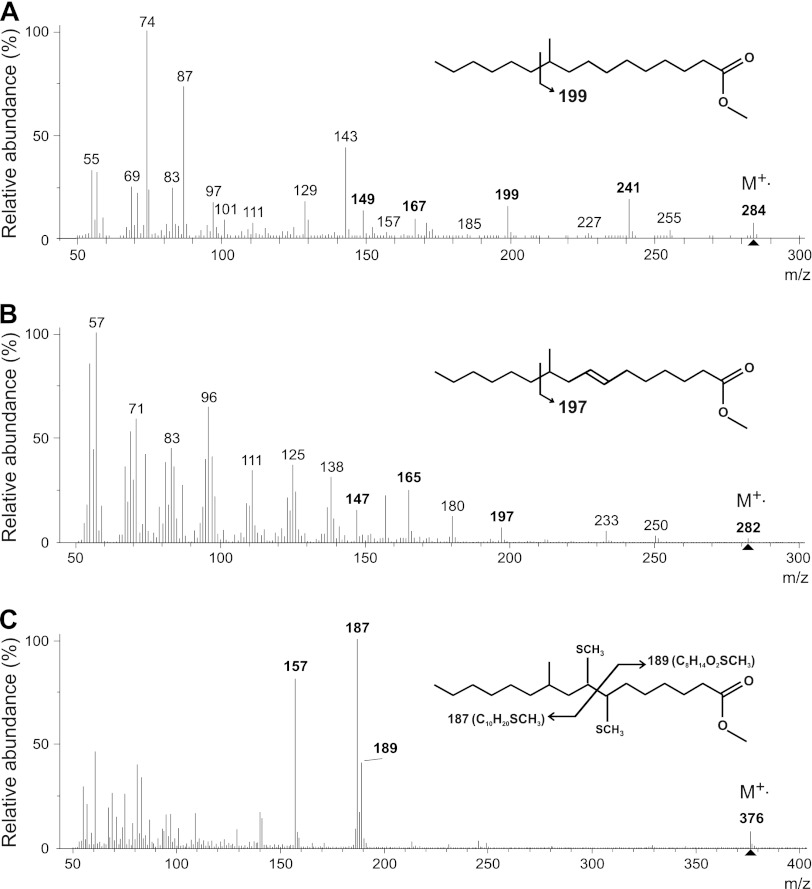
Fig 2.
Mass spectra of the fatty acids (FAs) 10MeC16:0 (A) and 10MeC16:1Δ7 (B) (analyzed as methyl ester derivatives), two key components of the lipid profile of enrichment cultures of Methylomirabilis oxyfera. The 10MeC16:1Δ7 FA thus far has been reported only in these enrichment cultures. (C) The position of the double bond in the 10MeC16:1Δ7 FA was deduced from the mass spectrum of the FA methyl ester after DMDS adduction.

