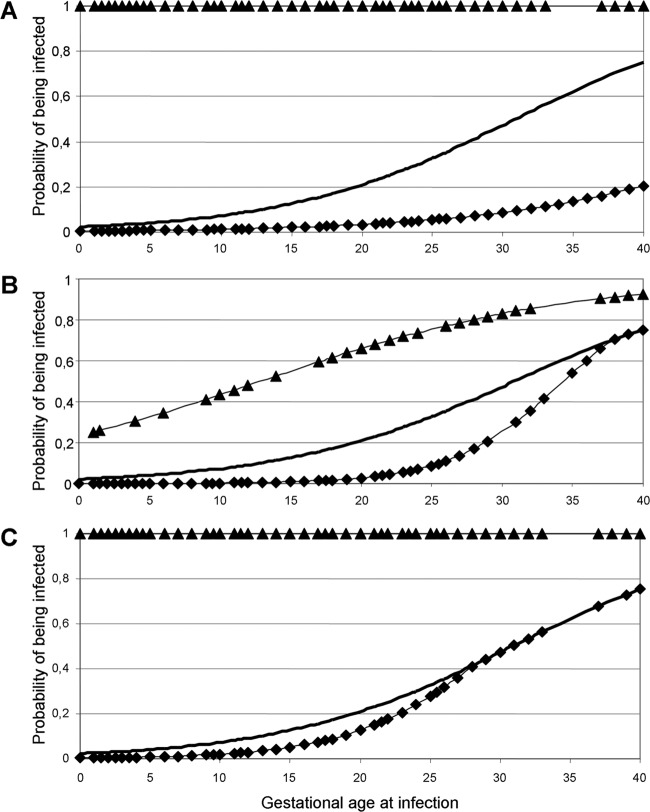
Fig 2.
Assessment of the actual risk of congenital toxoplasmosis using posttest predictive values of amniotic fluid, placenta, and/or cord blood PCR results. Determination of the final diagnosis at the end of child follow-up allowed the calculation, in our cohort, of the prevalence of congenital toxoplasmosis (or pretest risk) according to gestational age at maternal infection, all along the course of pregnancy (bold curve). We then calculated the same risk but differentiating, for each case, positive and negative PCR results (posttest probabilities of being infected). Solid triangles, posttest risk curves when the PCR test was positive (PPV); solid diamonds, posttest risk curves when the PCR test was negative (1 − NPV). These curves are represented on three graphs for amniotic fluid (A), placenta (B), and cord blood (C). Results from all of the cases in this study are shown on the logistic regression curves.

