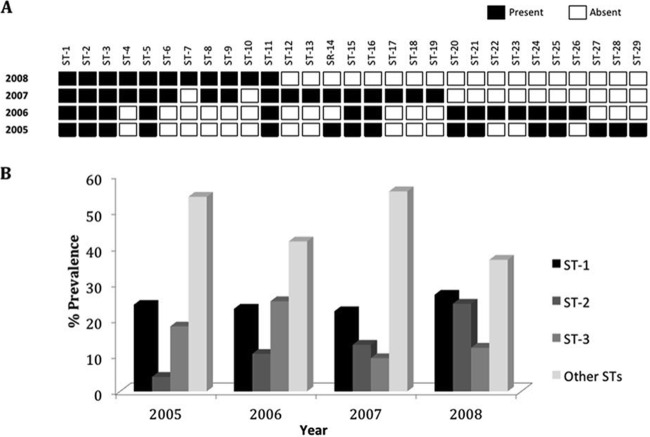
Fig 2.
Longitudinal distribution of Neisseria gonorrhoeae strains. (A) Occurrence of the STs over a 4-year period. Solid squares indicate the presence of certain STs, while open squares indicate their absence. (B) Prevalence rates of the most predominant circulating strains compared to the prevalence rates of all other STs identified during the 2005-2008 study period in Saskatchewan.

