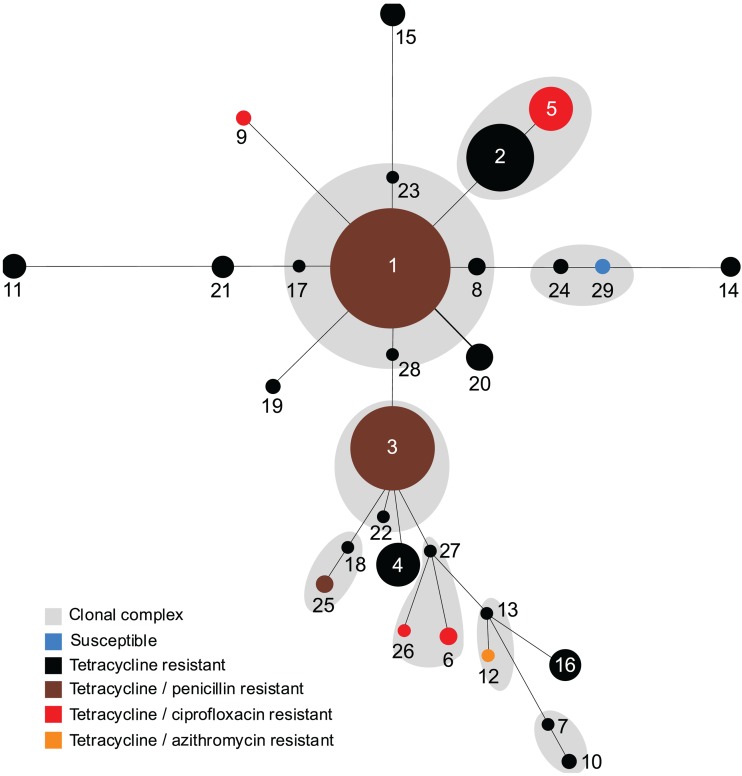
Fig 4.
Minimum spanning tree based on the multilocus sequence typing allelic profiles depicting the antibiotic-resistant phenotype distribution across Neisseria gonorrhoeae lineages and their clonal complexes. Each circle represents a unique ST. The number of isolates of each ST is directly proportional to the area of the circle. The blue circle represents the ST susceptible to all tested antibiotics, while black indicates resistance to tetracycline alone, brown indicates resistance to penicillin and tetracycline, red indicates resistance to ciprofloxacin and tetracycline, and orange indicates resistance to azithromycin and tetracycline. Gray shadings represent the clonal complexes which consist of single-locus variants.

