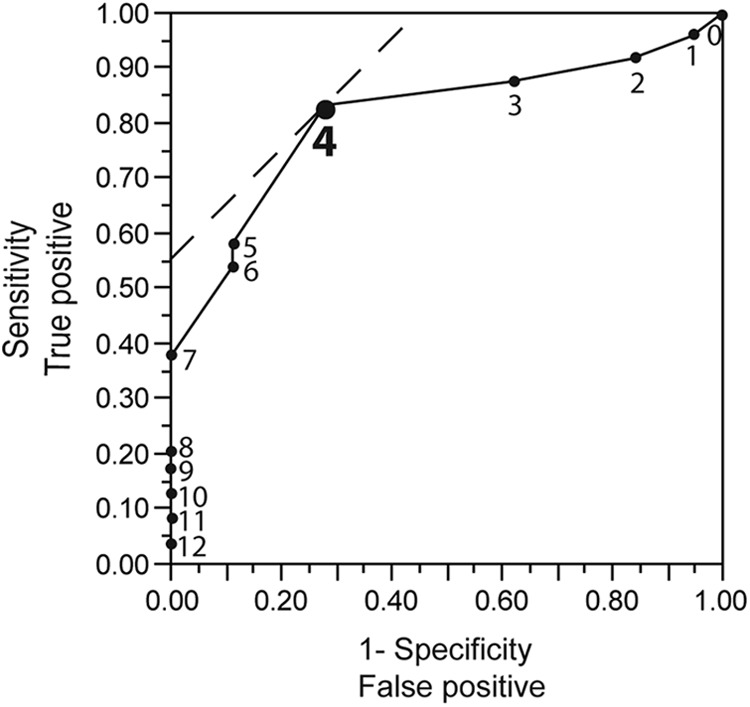
Fig 3.

ROC curve analysis of IRRDR[HCV-4] sequence heterogeneity for SVR prediction. The solid line curve shows the AUC. Solid circles with numerals plotted on the curve represent different numbers of IRRDR mutations analyzed. The dashed line in the upper left corner indicates the optimal number of IRRDR[HCV-4] mutations for SVR prediction, which yields the highest sensitivity (84%) and the highest specificity (72%).
