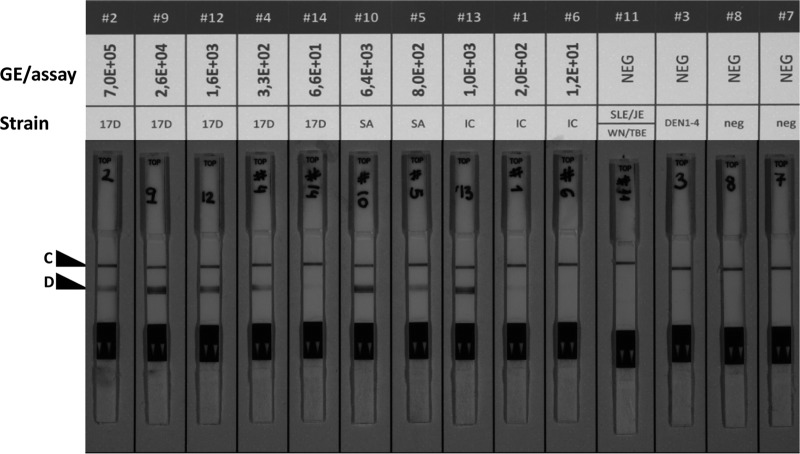
Fig 1.
Performance of the isothermal YF RT-tHDA assay. Dilutions of plasma samples representing different strains of YFV (samples labeled 2, 9, 12, 4, 14, 10, 5, 13, 1, and 6 at the top of the image), other related flaviviruses (samples 11 and 3), and negative controls (samples 8 and 7) were subjected to the YFV RT-tHDA assay. The correct performance of the lateral-flow detection method is confirmed by the presence of the control line, C, in all test stripes. Positives samples are identified by the presence of the additional detection line, D.

