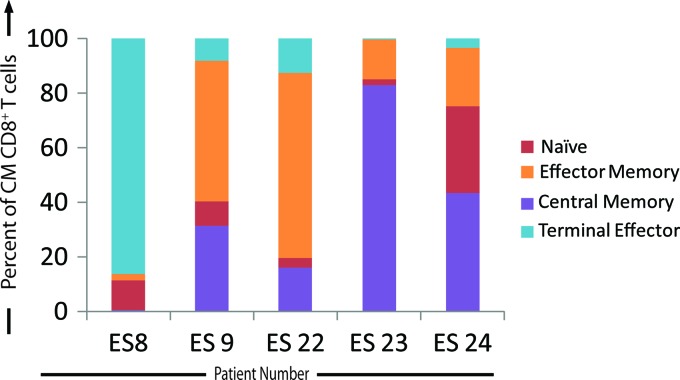
Fig 3.
Changes in the CM CD8+ T cell population by day 5 after infection. Sorted CD8+ T cells were cocultured with infected CD4+ T cells on day 0. On day 5, CD8+ T cells were stained with anti-CCR7 and anti-CD45 RA antibodies, and the expression of these markers was analyzed and quantified on day 5 after infection (n = 5). The percentage of the CD8+ T cells expressing markers indicative of a TE (light blue bars), EM (orange bars), naïve (red bars), or CM (purple bars) phenotype is indicated for each ES analyzed.

