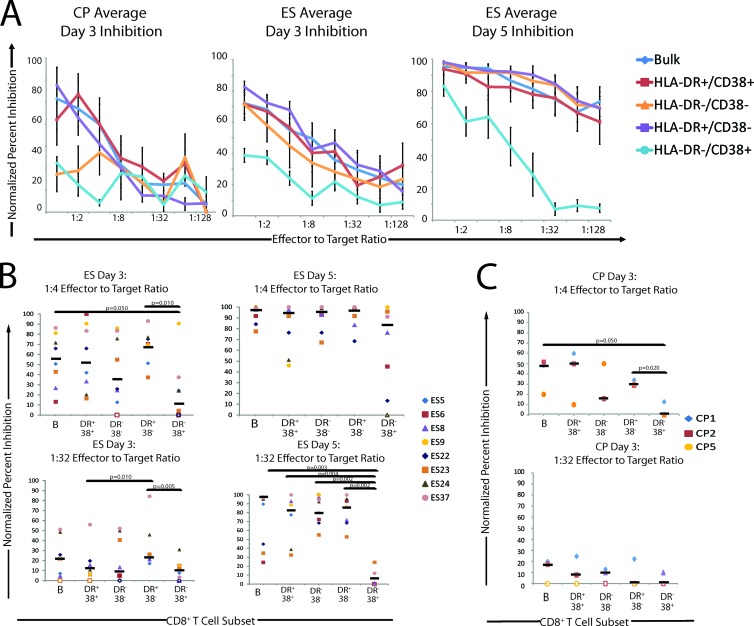
Fig 6.
(A) Analysis of normalized percent inhibition for CD8+ T cell activation subsets on days 3 and 5 after infection. (B) Average, normalized percent inhibition plots for ES (n = 8) and CP (n = 3) at different E:T ratios on day 3 for CP and ES and day 5 for ES. The normalized values for inhibition of bulk CD8+ T (blue diamonds), HLA-DR+ CD38+ CD8+ T cells (red squares), HLA-DR− CD38− CD8+ T cells (orange triangles), HLA-DR+ CD38− CD8+ T cells (purple squares), and HLA-DR− CD38+ CD8+ T cells (light blue circles) are shown. Open data points indicate a normalized percent inhibition of 0. Error bars represent the standard errors of the means. (B and C) Quantification and comparison of normalized percent inhibition for each subpopulation at a 1:4 and a 1:32 E:T ratio for the ES group (n = 8) (B) and the CP group (n = 3) (C). The normalized percent inhibition for each patient and each CD8+ T cell subpopulation is shown at a 1:4 E:T ratio (top) and a 1:32 E:T ratio (bottom) for day 3 (CP and ES) and day 5 (ES). Bulk (B), HLA-DR+ CD38+ (DR+ 38+), HLA-DR− CD38− (DR− 38−), HLA-DR+ CD38− (DR+ 38−), and HLA-DR− CD38+ (DR− 38+) CD8+ T cells were compared. Open circles indicate a normalized percent inhibition of 0. The median value of the normalized percent inhibition for each subpopulation is indicated (n = 8). Only significant P values are indicated.

