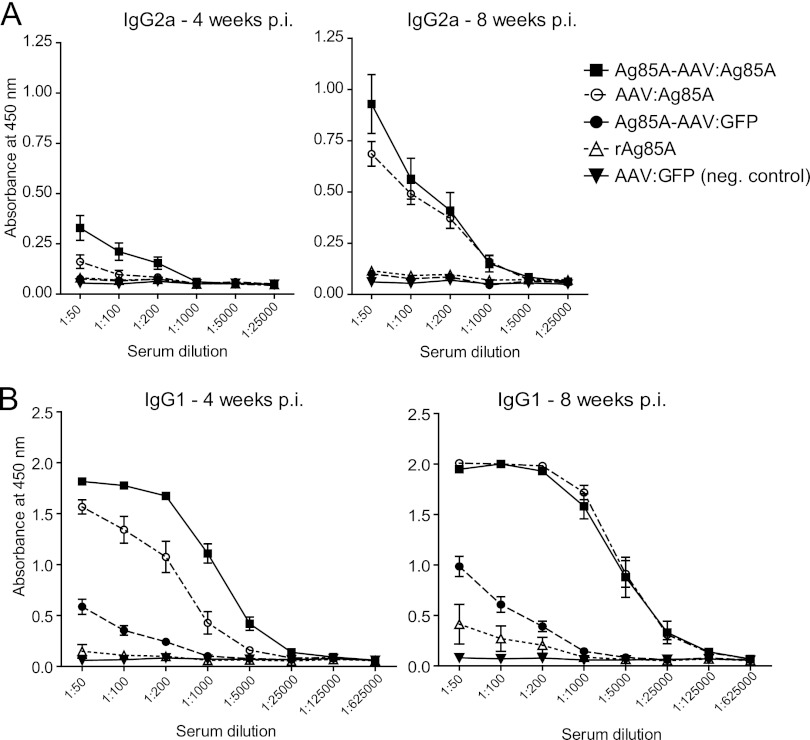
Fig 4.
Anti-Ag85A-specific IgG1 and IgG2a humoral immune response. IgG subclasses were determined prior to injection (not shown) and 4 and 8 weeks p.i. by ELISA. On the y axes, anti-Ag85A IgG1 (B) and IgG2a (A) antibodies are displayed as absorbance at 450 nm. Error bars indicate the standard error of the mean. IgG2a (A) was only detected in relevant amounts in the Ag85A-AAV:Ag85A and AAV:Ag85A groups. At 4 and 8 weeks p.i., the prime-boost vaccine evoked a significantly higher IgG2a response than AAV:Ag85A (P = 0.0031 and 0.0483, unpaired two-tailed t test; dilution factor, 1:50). The IgG1 response (B) was similar to that for total IgG (Fig. 3).

