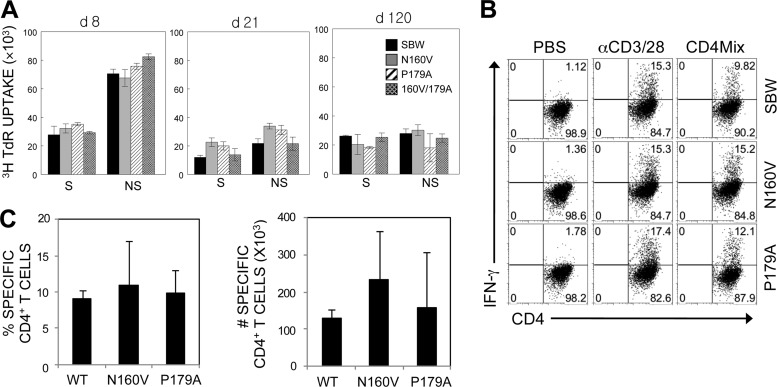
Fig 5.
Reactivity of CD4+ T cells in mice infected with WT and variant viruses. (A) Splenic cells from mice infected with WT and variant viruses at 8 days postinfection were stimulated for 3 days in the presence of PBS or a structural CD4+ T cell epitope mix (S; VP1233-250, VP274-86, and VP324-37) and the predominant nonstructural epitope (NS; 3D21-36). Proliferation levels were assessed by [3H]TdR uptake. (B) CNS-infiltrating MNCs were stimulated with PBS or a CD4+ T cell epitope mix (VP1233-250, VP274-86, VP324-37, and 3D21-36). After 6 h of stimulation, cells were stained for CD4 and intracellular IFN-γ. The percentage of CD4+ IFN-γ-producing cells is shown in the upper right corner of each plot. The data are representative of three independent experiments. (C) Epitope-specific IFN-γ production by CNS-infiltrating CD4+ T cells. The proportion of epitope-specific CD4+ T cells in the CNS (left) and the number of epitope-specific CD4+ T cells (right) are shown. The values given are the means of the percentages or numbers from 3 independent experiments (mean ± SD).

