
Fig 2.
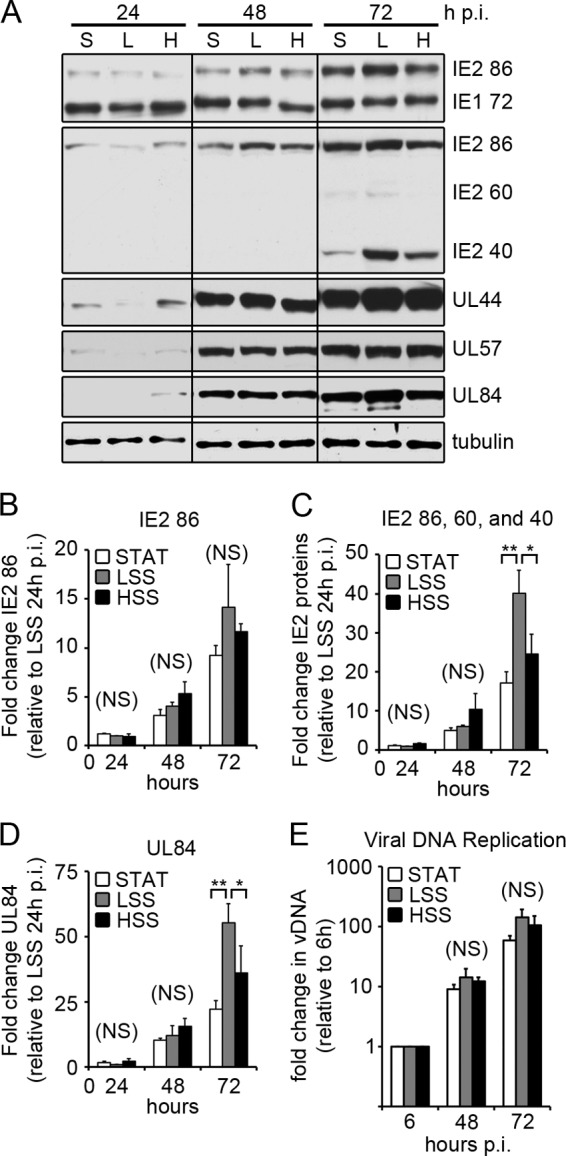
Viral IE and early gene expression. (A) ECs were infected 24 h after exposure to STAT, LSS, and HSS with TB40/E (3 PFU/cell for STAT and HSS; 0.75 PFU for LSS). At the indicated times p.i., cell lysates were assayed for viral protein expression by Western blotting (S, STAT; L, LSS; H, HSS). Here, we show representative blots from five independent experiments. Multiple blots were required to probe for all the proteins. Comparable loading on each blot was confirmed by amido black staining, while one blot was probed for α-tubulin. (B to D) ECs were infected as stated for panel A and collected at the indicated times. Viral mRNA expression was measured by quantitative RT-PCR with primers specific for IE2 86 (B), IE2 exon 5 (C), and UL84 (D). Viral mRNAs were normalized to α-tubulin, and each time point is relative to expression of LSS at 24 h p.i. Data represent the means ± SD from three independent experiments. (E) ECs were collected at the indicated times p.i., and vDNA was measured by qPCR. The fold increase in vDNA was calculated relative to input vDNA (at 6 h p.i.). Data represent means ± SD from 3 independent experiments.