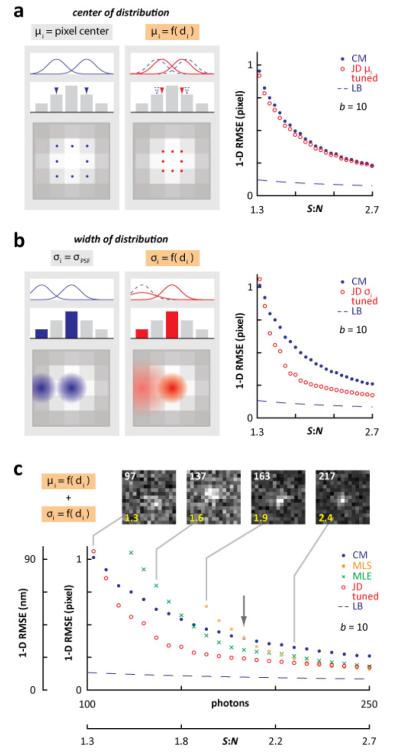
Fig. 3.
Tuning μi and σi to maximize localization precision near the detection limit. The 1-D RMSE in location of a point source was determined using 104 computer-generated images (15×15 pixels, 50-250 emitter photons, b = 10) per data point. JD localizations were determined by varying peak position (μi) and/or width (σi). Errors obtained using CM, MLS, and MLE, plus the lower bound (LB), are included for comparison (MLS/MLE plots smoothed by linear regression). (a) Varying μi depending on distance, di, from the most intense pixel (σi = σPSF for all distributions). Peaks of distributions are shifted towards the brightest pixel (in this example the central one) by ½ a pixel in both x- and y-dimensions. Left: cartoon illustrating how this shift applies to selected distributions (from blue curves/dots to red curves/dots). Right: JD localization yields 5% less error than CM for all S:N shown. (b) Varying σi as a function of distance, di, from the most intense pixel (as μi = pixel center for all distributions). Widths of distributions from the brightest pixel remain equal to σPSF, as those from surrounding ones expand. Left: cartoon illustrating these changes for selected distributions (from blue curves/halos to red curves/halos). Localization using JD yields up to 36% less error than CM. (c) Varying both peak position and width (as in (a) and (b), but using an x and y shift of ¼ pixel for μi). Representative images are shown (with photon counts given in white, and S:N in yellow). At this low S:N, JD localization yields less error than other methods. Arrow: condition used in Fig. 4. Error over the full range of S:N is shown in Supplemental Fig. 2. The effects of window size and offset of emitter from window center are shown in Supplemental Fig. 3.

