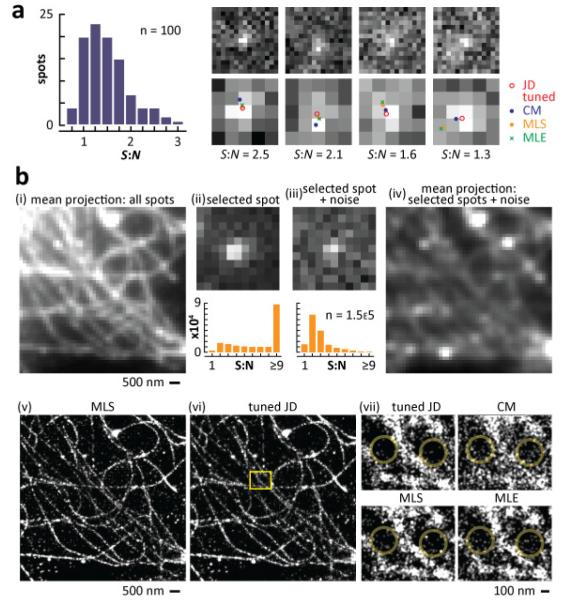
Fig. 5.
Localization using ‘real’ images of transcription sites and microtubules in monkey cells (cos-7). (a) Nascent RNA at transcription sites. Cells expressing an EGFP gene containing an intron were fixed, and (nascent) EGFP transcripts detected using RNA FISH with probes targeting a short (sub-resolution) segment of the intron; images were collected using a wide-field microscope and CCD (90-nm pixels). One-hundred spots with S:N < 3 (histogram) were chosen manually, and four examples are shown at the top; the panels below illustrate the central 5x5 pixels in the upper panels, with 2-D localizations obtained by the different methods. As S:N decreases (left-to-right), localizations become more scattered (see Media 2 for results with all 100 spots). (b) Microtubules. Cells were fixed, microtubules indirectly immuno-labeled with Alexa 647, and a series of 30,000 images of temporally- and spatially-separated spots of one field collected using inclined illumination and an EM-CCD (155-nm pixels); 154,040 windows (11×11 pixels) containing 1 centrally-located spot were selected for analysis (using a Gaussian spot-finding algorithm). (i) Mean projection of all windows. (ii) One representative window (the histogram below illustrates the number of windows with different S:N). (iii) Individual windows were deliberately corrupted with noise (typical example and histogram shown). (iv) Mean projection of all resulting windows. Individual windows were now passed to each of the four methods, and localizations convolved with a 20-nm Gaussian intensity profile to aid visualization. (v, vi) Localizations obtained by MLS and the tuned version of JD yield roughly equivalent images. (vii) Magnified areas of the inset in (vi). Large circles in JD images contain fewer isolated results than the others, consistent with fewer mis-localizations (see also Supplemental Fig. 4(d)).

