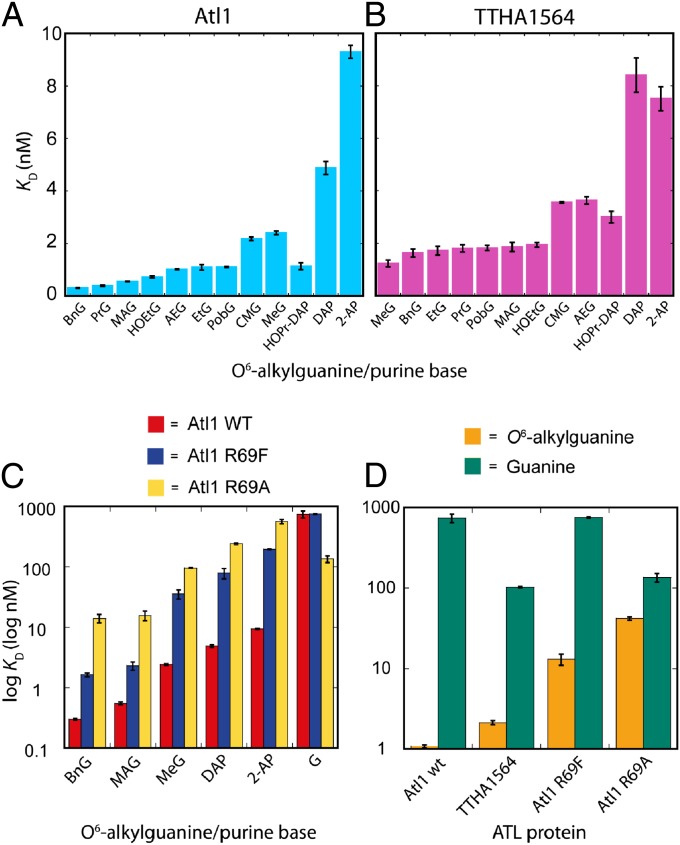
Fig. 3.
Equilibrium dissociation constants (KD values) determined for ATL–DNA complexes using ss ODNs containing O6-alkylguanine and other purine bases (structures, analog abbreviations, and the ODN sequence are shown in Fig. 1) with the following proteins: (A) Atl1 from S. pombe, (B) MBP-TTHA1564 from T. thermophilus, (C) Atl1 wild type (red), Atl1 mutant proteins R69F (blue) and R69A (yellow), (D) Atl1 wild type, Atl1 R69F and R69A mutants with ss ODNs containing O6-alkylguanine (mean KD values) (gold) or guanine (green). Log KD values are displayed in C and D.

