Fig. 1.
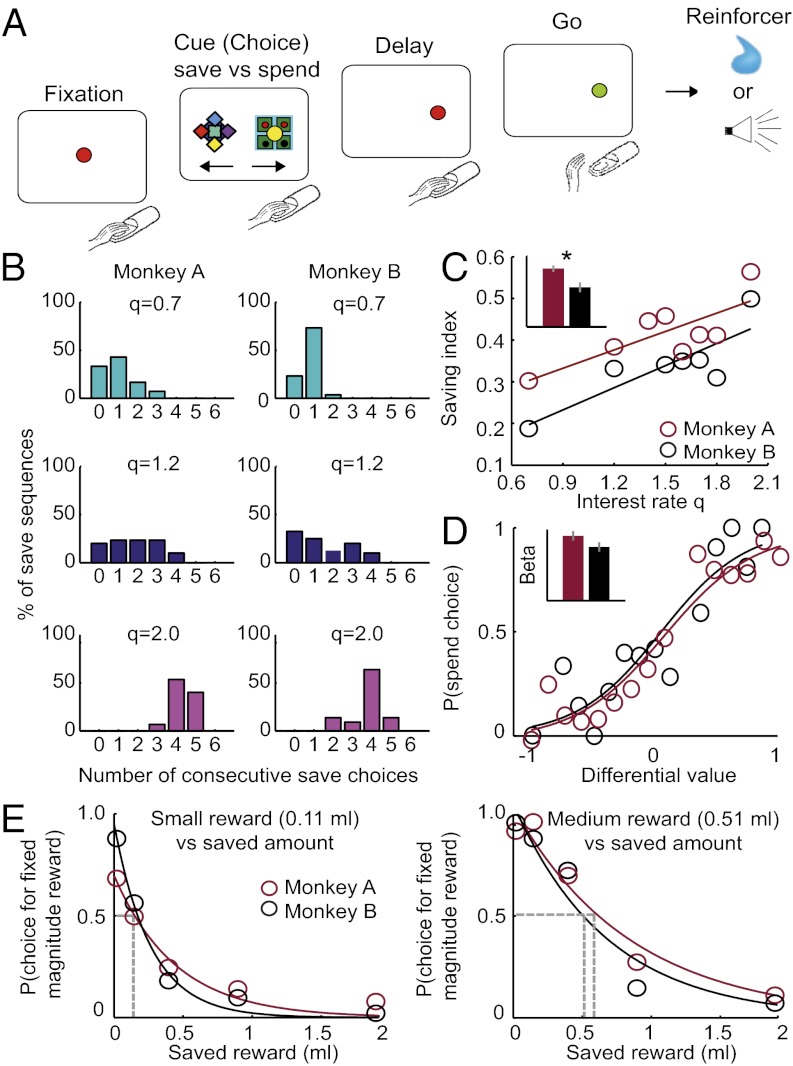
Behavioral task and economic choice behavior. (A) Sequence of events in the free choice save–spend task. Monkeys indicated their choices with a saccade to one of two visual cues. Specific cues predicted save and spend options; different save cues indicated different interest rates. (B) Monkeys made more consecutive save choices with higher interest rates. Percentage of observed save sequences in six representative sessions with different interest rates (q). (C) Saving index increased as a function of interest rate (monkey A: R2 = 0.61; monkey B: R2 = 0.71; both P < 0.03, linear regression), and mean index differed between monkeys (Inset; P = 0.005, paired t test; error bars denote ± SEM). (D) Spend probability as a function of differential subjective value between save and spend options (color code is the same as in C, and curves represent logistic fits to choice data). Inset shows standardized logistic regression coefficients (both P < 1 × 10⁻⁸, t test for logistic regression coefficient; error bars denote ± SEM). (E) Control test with fixed reward. On random trials (in sessions with the same interest rate), monkeys chose between a fixed reward (0.11 or 0.51 mL, indicated by different cues) and the accumulated saved amount. Intersections between horizontal gray lines and choice curves (exponential fits) indicate points of subjective indifference between fixed and saved rewards.

