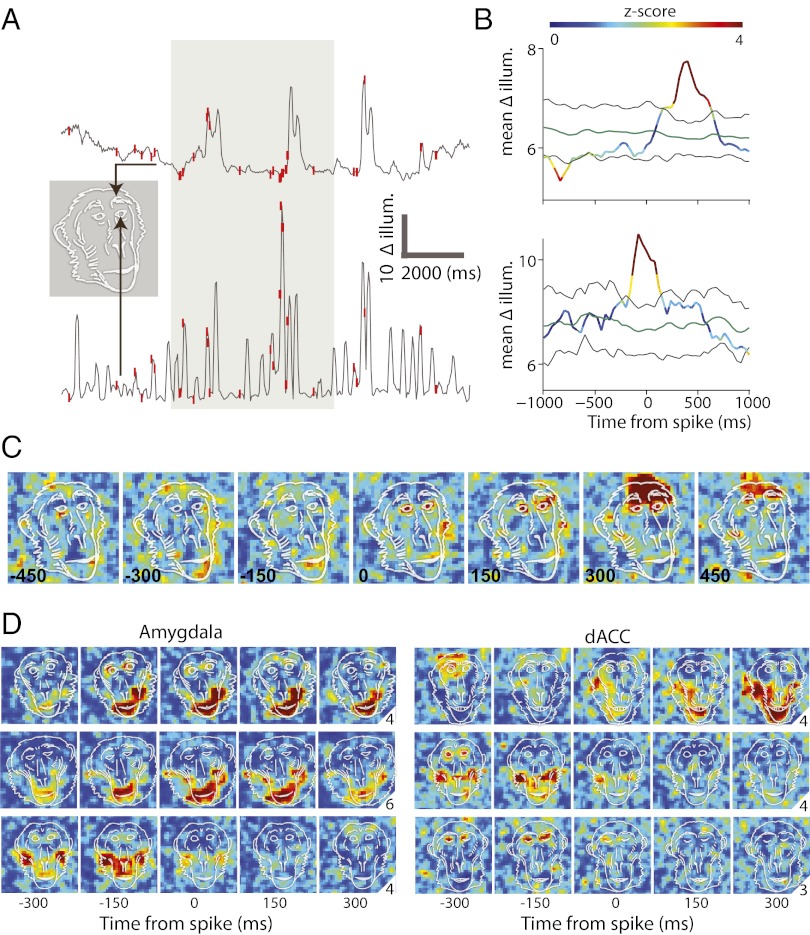
Fig. 2.
STMAs reveal locking to self facial expressions. (A) Shown are movement/illumination traces from two different pixels (arrows) taken from a single trial and overlaid by single spike discharge times (red ticks). The gray-marked area indicates shutter opening. (B) STMA was computed for the spikes that occur during shutter opening. STMA was normalized (z-scored) and color-coded by the distribution of 100 within-trial shuffling of spikes and recomputation of STMAs. Green and black lines indicate the mean and 95% confidence intervals of the shuffled STMAs. (C) STMAs were computed for all of the pixels within the frame and color-coded by the corresponding z-score value of the pixel’s STMA at each of the different time delays from spike occurrence (indicated by the number at the lower-left corners). Note that significant pixels before spike discharge (time ≤ 0; lower example) indicate that the cell fired mostly following movement, and significant pixels after spike discharge (time > 0; upper example) indicates that the cell’s spikes mostly precede movement. The overlaid monkey face is not a scheme but an exact outline of the real frame. (D) Six more examples: STMAs of three amygdala (Left) and three dACC (Right) cells overlaid by real contours of the monkeys face in the same session. Numbers at the right lower corner correspond to the maximum value of the color code used at each example. Most cells had an STMA with clear responses at mouth or eye and eyebrows related pixels.

