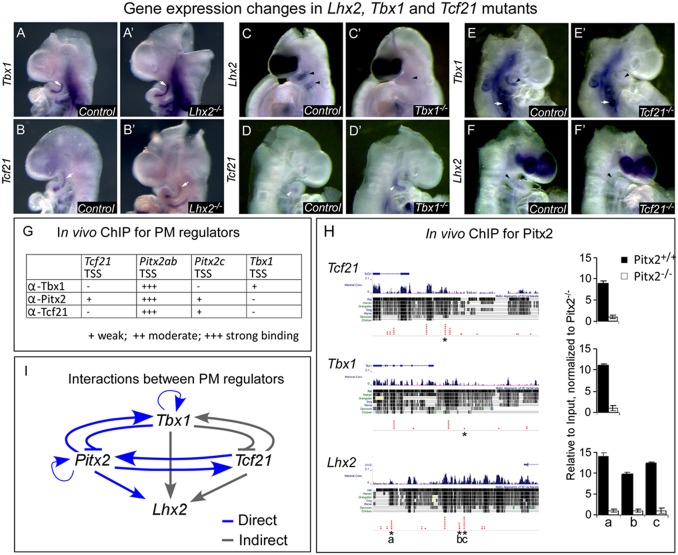
Fig. 2.
Genetic interactions between members of the PM network. (A–F′) Whole-mount in situ hybridization for the indicated genes (Left) in E9.5 embryos with the indicated genotypes (black rectangles). Arrows/Arrowheads mark the PM; white arrows, unchanged expression; black arrowheads, down-regulated genes; white arrowheads, up-regulated genes. (G) A ChIP experiment using pharyngeal arch tissues at E9.5 with Tbx1, Pitx2, and Tcf21 antibodies. (H) A ChIP-seq experiment using Pitx2 antibody on Pitx2+/+ and Pitx−/− pharyngeal arches, reveals specific interactions with Tcf21, Tbx1, and Lhx2 regulatory regions. (I) A model summarizing direct (blue) and indirect (gray) genetic interactions in the PM regulatory network. TSS, transcription start site (or proximal promoter). Asterisks point to the indicated transcription factor binding site. Number of embryos in each experiment was ≥ 3.

