Fig. 1.
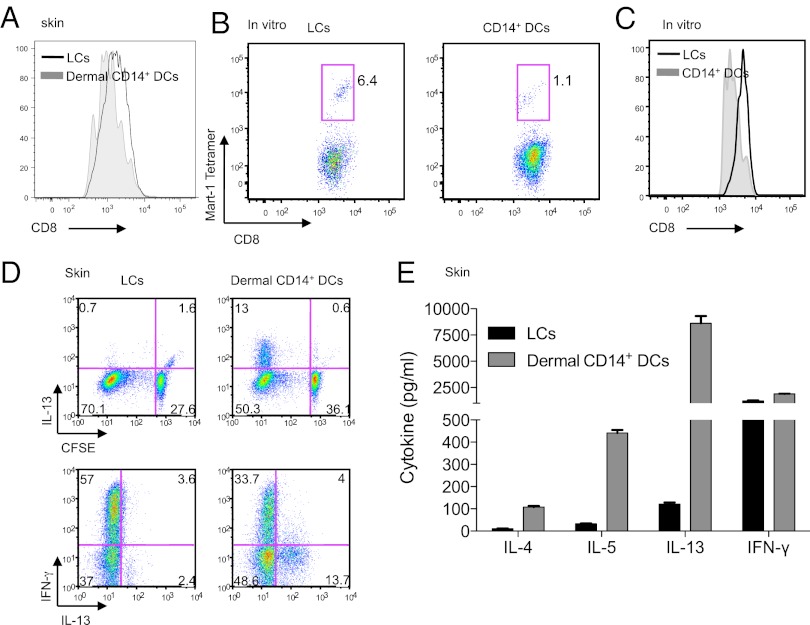
Dermal CD14+ DCs prime CD8low TC2 cells. (A) Naïve CD8+ T cells were primed for 7 d by CD40L-activated skin isolated DC subsets: LCs (black) and dermal CD14+ DCs (gray). CFSElo cells were analyzed by flow cytometry for the expression of CD8 coreceptor. (B) In vitro CD40L-activated HLA-A201+ DC subsets were loaded with MART-1 peptide and used to prime naïve CD8+ T cells. Following two consecutive stimulations, cells were analyzed by flow cytometry for CD8 intensity and frequency of MART-1 tetramer-binding cells. (C) CD8 mean fluorescence intensity (MFI) expression of HLA-A201–MART-1 tetramer-binding CD8+ T cells, primed by in vitro CD40L-activated peptide-loaded autologous LCs and CD14+ DCs. Shown is 1 of 17 independent experiments. (D) CFSE-labeled naïve CD8+ T cells were primed for 7 d by CD40L-activated LCs and dermal CD14+ DCs. The cells were then expanded for 48 h with anti-CD3 and -CD28 mAbs and IL-2. Intracellular expression of IL-13 and IFN-γ was assessed by flow cytometry after additional 5-h stimulation with phorbol 12-myristate 13-acetate (PMA) and ionomycin in the presence of monensin. Data are representative of three independent experiments. (E) CFSE-labeled naïve CD8+ T cells were primed for 7 d by skin CD40L-activated LCs and dermal CD14+ DCs. CFSElo cells were sorted at the end of the culture and restimulated for 48 h with anti-CD3 and -CD28 mAbs. The cytokines IL-13, -5, -4, and IFN-γ were measured in the culture supernatant by using Luminex.

