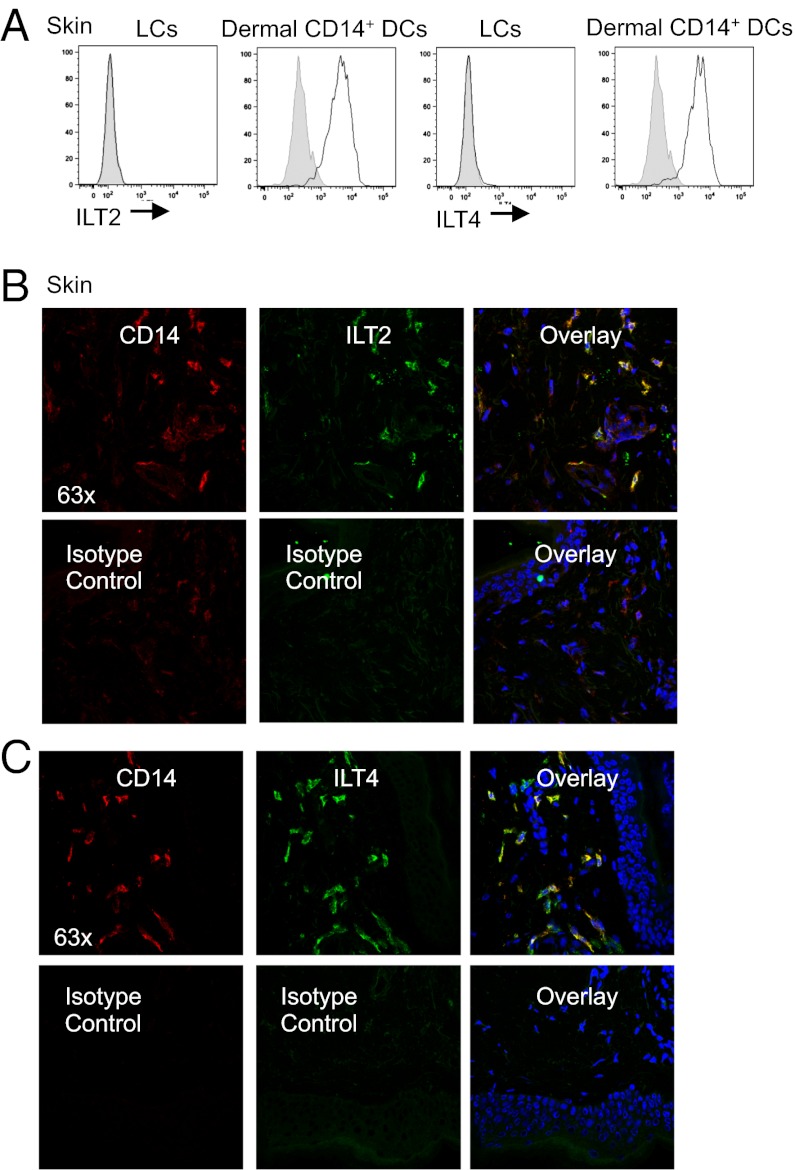
Fig. 3.
Expression analysis of the ILT family receptors by the skin DC subsets. (A) Flow cytometry analysis of the ILT2 and ILT4 receptors on the surface of LCs and dermal CD14+ DCs (black histogram); gray histogram represents isotype control. Data are representative of at least four independent experiments. (B and C) Immunofluorescence staining of ILT2 (B) and ILT4 (C) receptors on sections of human dermis. ILT is visualized in green, CD14 in red, and cell nuclei in blue.

