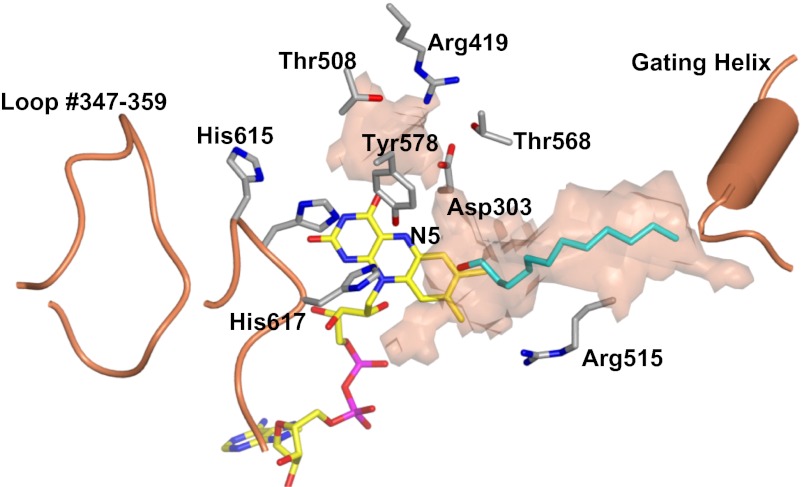
Fig. 3.
Active site of ADPS. Protein carbons are shown in gray; flavin carbons, in yellow; ligand carbons, in cyan; oxygens, in red; nitrogens, in blue; and phosphorous, in magenta. The substrate-binding site tunnel was calculated with a 1.4-Å radius probe. The semitransparent surface outlines the “probe-accessible” region of the tunnel. # indicates residues from the opposite subunit of the dimeric enzyme. The orientation is the same as that of the subunit shown in Fig. 2A.

