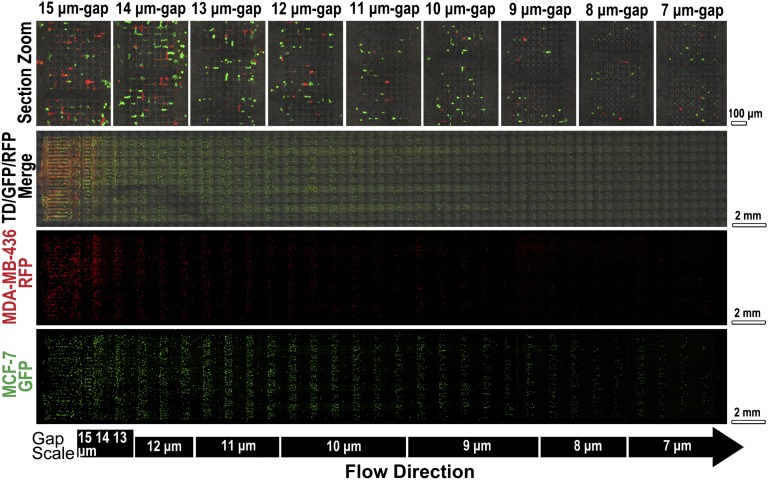
Fig. 2.
Fluorescence images of cells retained on MS-chip after separation of MCF-7/GFP and MDA-MB-436/RFP cells. Gap sizes are shown on the left. Green, red, and merged channels are shown in the first three columns to demonstrate cell types trapped on the MS-chip. Higher magnification images of the merged image are on the right, indicating the efficiency of separation through gaps ranging in size from 15 to 7 μm.

