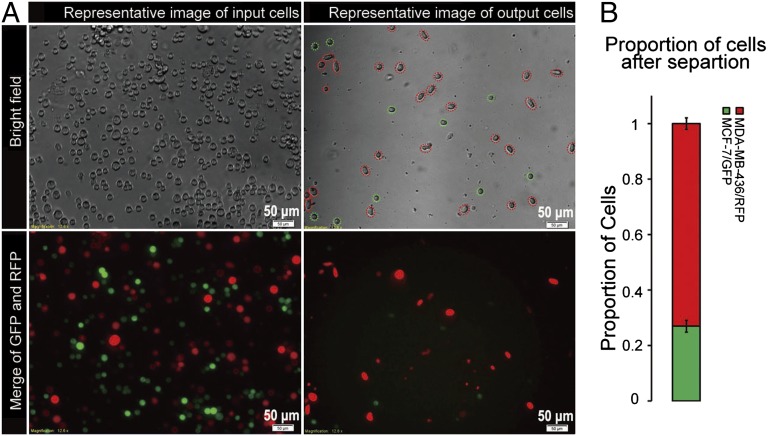
Fig. 3.
(A) Comparison of input and output cells in a typical MCF-7/GFP and MDA-MB-436/RFP separation. Both bright-field and fluorescence images are presented. The representative image of input cells (cell sample before loading into the MS-chip) shows approximately equal numbers of green and red cells (Lower, Left), and the representative image of output cells (cells that passed through the entire MS-chip and were collected at the outlet) shows a significantly enriched population of red cells (Lower Right). (B) The bar graph displays the proportion of MCF-7/GFP and MDA-MB-436/RFP cells after separation of an equal mixture. Values represent mean ± SD from three independent experiments analyzing 250–300 cells each.

