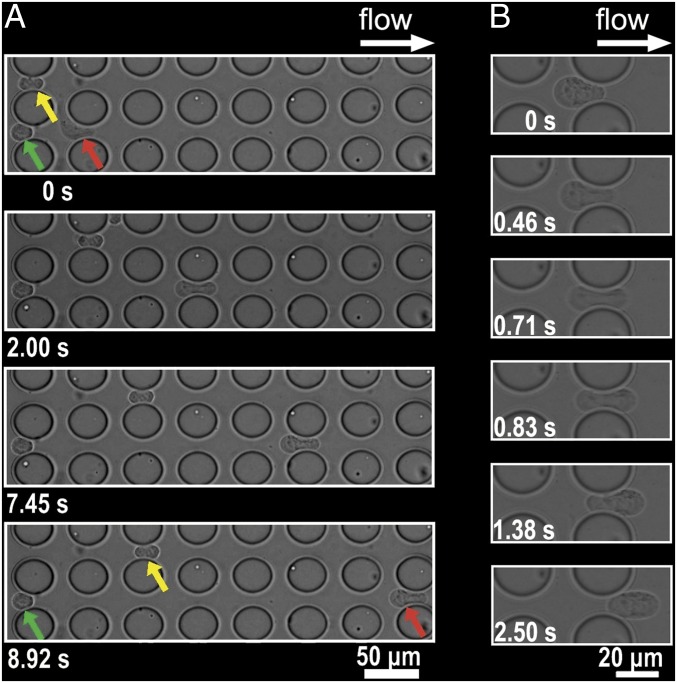
Fig. 4.
(A) Images of SUM149 cells crossing the MS-chip gaps. Red, green, and yellow arrows indicate different levels of cell deformability. The most flexible cell type (red) crosses the entire barrier array; the less flexible one (yellow) crosses halfway; and the least flexible one (green) stops at the initial intersection. (B) High-magnification images show cell deformation in the right six frames.

