Fig. 5.
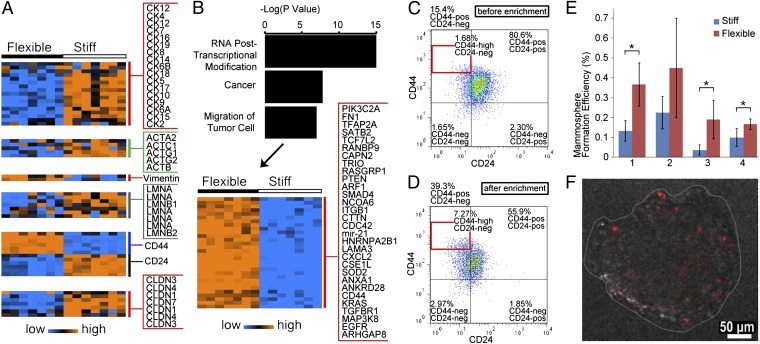
(A) Heat map shows expression levels of cytokeratins, actins, vimentin, lamins, CD44, CD24, and claudins in flexible and stiff cells. The genechip contains more than 54,000 probe sets, including 38,500 for human genes. Some genes have multiple probe sets. (B) Bar graph of the top three cell functions over the –log(p). The heat map shows 30 significantly overexpressed genes in the cell movement category. (C and D) Scatterplot of CD44/CD24 expression for SUM149 cells before (C) and after (D) MS-chip separation. (E) Mammosphere formation efficiency of flexible vs. stiff subpopulations. All four replicates show consistently greater efficiency in flexible cells. *P < 0.05. (F) Representative fluorescence image of a mammosphere derived from PKH26-labeled flexible SUM149 cells. PKH26 is significantly diluted during mammosphere formation.

