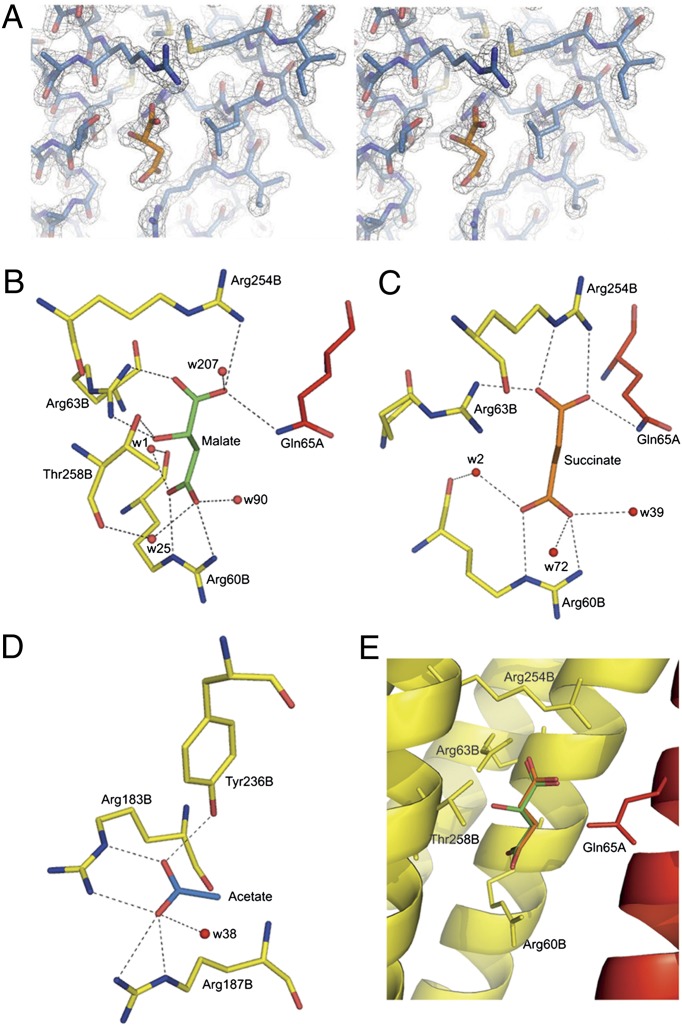
Fig. 3.
Structural basis for ligand recognition at McpS-LBR. (A) Representative section of the final 2Fo−Fc electron density map including data from 25 to 1.8 Å contoured at 2.5 σ above the mean of the map. The region shown corresponds to the malate-binding site with a molecule of malate shown. (B and C) View of the interaction of malate (B) and succinate (C) with the protein. Q65 is from the A monomer, whereas the remaining interactions are with the B monomer. (D) View of the interaction of acetate with McpS-LBR. (E) Superimposition of structures containing malate (green) and succinate (orange).

