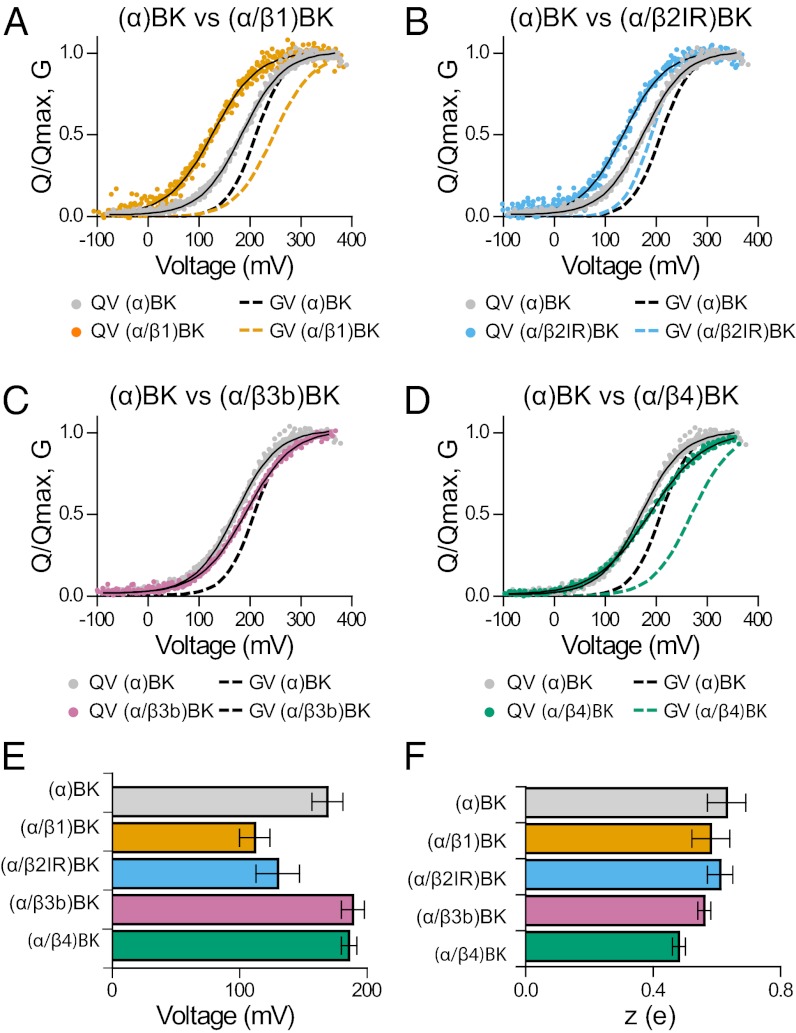
Fig. 2.
Gating charge–voltage relationships for (α)BK and (α/βx)BK channels. (A–D) Q–V and G–V relations for the indicated (α)BK and (α/βx)BK complexes. For comparison, all Q–V graphs include the Q–V curve from channels formed by the α subunit alone (gray circles). They also include G–V curves from ref. 33 for (α)BK (dashed black line), (α/β1)BK (dashed orange line), and (α/β2IR)BK (dashed sky-blue line). The G–V for (α/β4)BK channels (dashed bluish-green line) was from ref. 31). The data from many experiments (n = 7–14) were aligned by shifting them along the voltage axis by the mean ΔV1/2 = (<V1/2 > −V1/2), and fitted by Boltzmann function. (E and F) Quantification of V1/2 and z obtained from fits to the Q–V relations (mean ± SD; Table S1).

