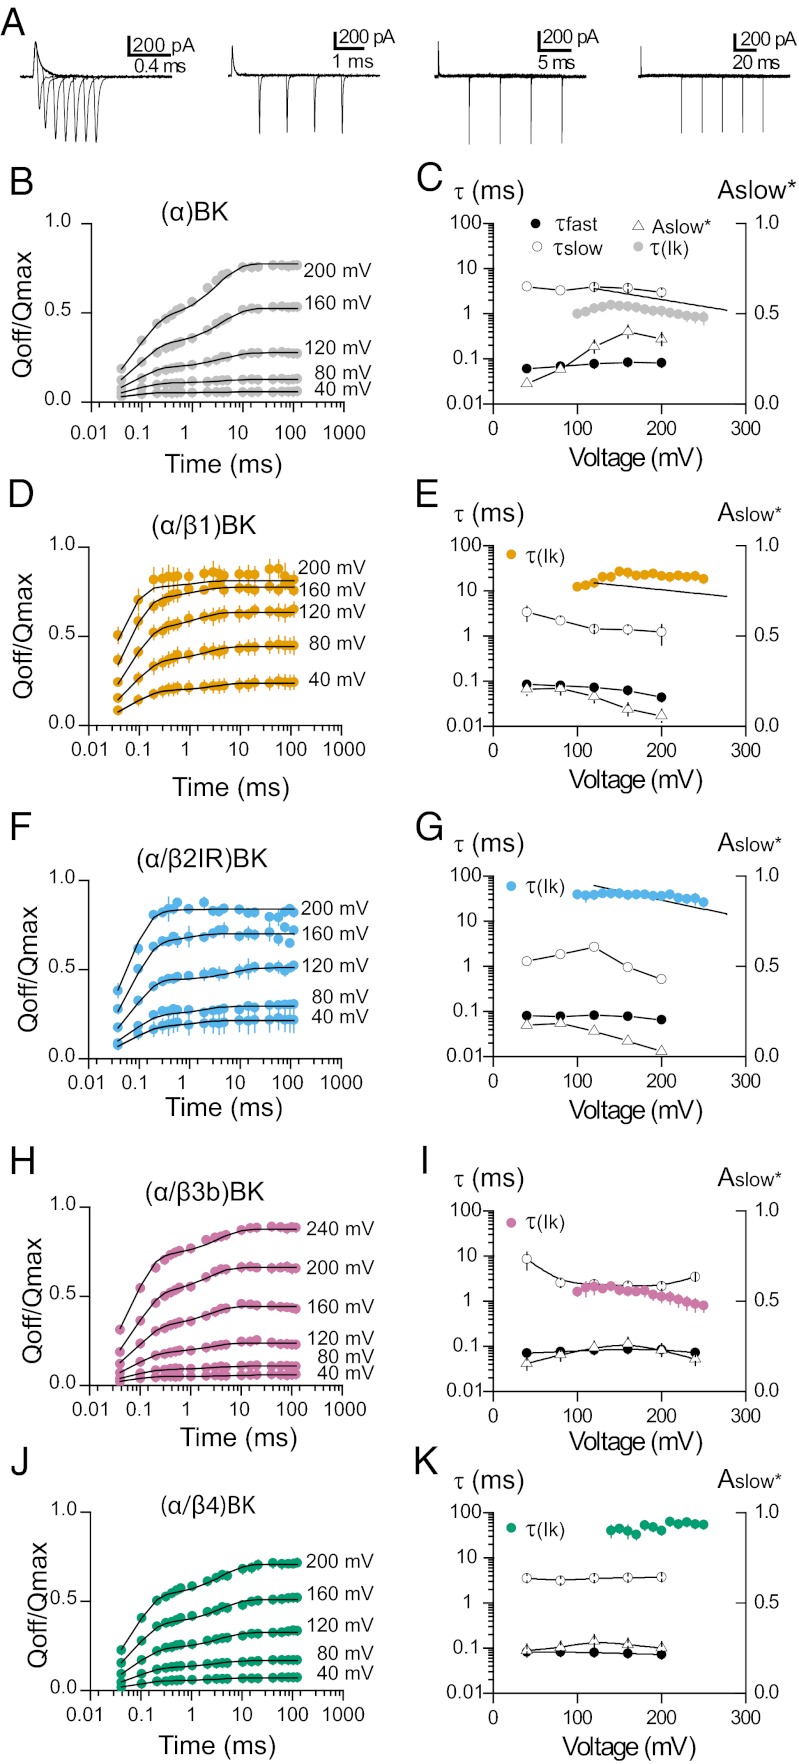
Fig. 3.
Slow gating charge kinetics. (A) Representative recordings of gating currents evoked by 200-mV pulses with different durations from 0.04 to 120 ms. Each family of Ig was recorded with different voltage pulse protocol at the same voltage. (B, D, F, H, and J) OFF charge as function of voltage pulse duration for (α)BK and (α/βx)BK (x =1–4) channels. The OFF charge (QOFF; filled circles, mean ± SEM) was integrated in a range of 1 ms, normalized to the QMAX for each patch, and plotted against the pulse duration (time; logarithmic scale) for different voltage steps (40, 80, 120, 160, and 200 mV). The QOFF vs. t relation was fitted with a two-component exponential function (solid line) with time constant an amplitude of the fast component constrained to the exponential fit of IgON at these voltages. (C, E, G, I, and K) Parameters defining the fast and slow components as a function of voltage for (α)BK and (α/βx)BK (x = 1–4) channels. For comparison the time constants of the IK activation (τIk, filled colored circles) are also shown. Time constants of the fast components of Ig (τfast) are represented by the open circles and the time constants of the slow components (τslow) are represented by the filled circles; Aslow* is the fractional amplitude of the slow components (Aslow* = Aslow/(Afast + Aslow), open triangles), and C and E–G include the fits over the linear range of the IK activation time constant reported by Orio and Latorre (20); solid black lines.

