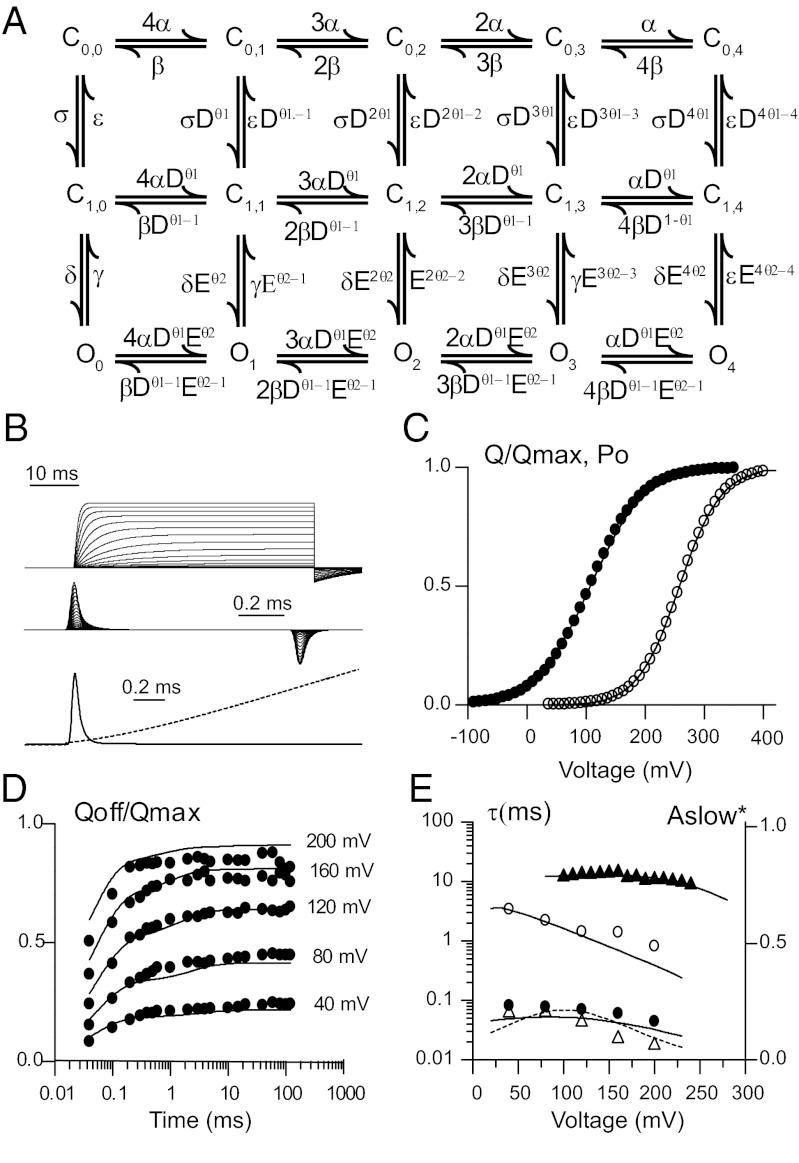
Fig. 4.
Allosteric model in which the channel gate opens in two sequential steps. (A) Diagram showing in each row the states corresponding to the different combination of the four voltage sensors either in the resting or active position with voltage-dependent rates α(V) and β(V). Columns depict a single gate that opens in two steps; the first governed by rates σ and ε connect to an intermediate closed state that then opens and closes with rates δ and γ, respectively. With the activation of each voltage sensor these transitions are favored by allosteric constant D and E. These allosteric constants will influence the forward rate by a fraction θ, whereas the backward rates by θ−1. (B) Simulated IK and Ig current experiments using this model with the following parameters: α = 1,880 s−1, β = 21,500 s−1 with zα = 0.49 and δα = 0.63. Transition rates between C0,i and C1,i were σ = 50.4 s−1 and ε = 205 s−1 with zε and δε set to 0. D was 2.75 with θ = 0.94 and δ = 0.9 s−1 and γ = 318, zδ = 0.604 and δδ = 0.726. Allosteric constant E was set to 1. Top traces correspond to simulated ionic current (Upper) and gating current traces during depolarizing steps of increasing amplitude. A 50-ms pulse from −90 mV that sweeps from +20 to 350 mV in 20 mV increments was used to simulate IK, whereas a 1-ms pulse spanning from −80 to 300 mV was preferred for Ig. Superimposed gating Ig (solid line) and IK (dashed line) at the beginning of a depolarizing pulse to +200 mV is shown (Lower). (C) Simulated Q–V and Po together with experimental data from (α/β1) BK channels. Q–V were obtained by integrating the first 500 μs of the simulated Ig at the end of the pulse. Po was obtained by normalizing the simulated current amplitudes at the end of a 120-ms pulse. Closed circles correspond to the experimental data described in Fig. 2C, whereas open circles correspond to normalized G–V (from ref. 33). (D) Fast and slow charge movement measured during repolarization to −90 mV following a depolarizing pulse of different durations and voltages. (E) Voltage dependence of the time constants of QOFF and IK in D and E; symbols correspond to data described in Fig. 3 and continuous line from simulated Ig at the same voltages and durations.

