Fig. 3.
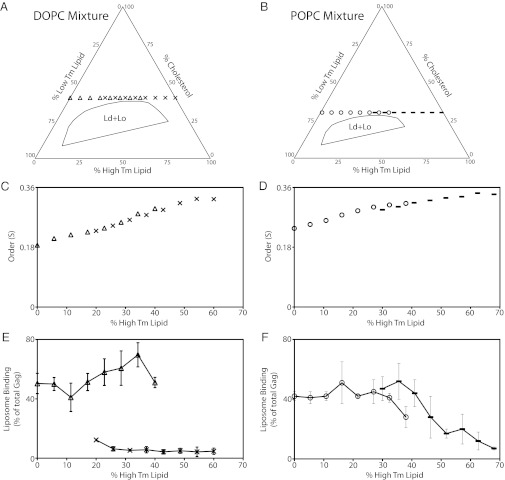
Membrane order has complex influence on HIV-1 Gag–liposome binding at fixed PS and cholesterol concentrations. HIV-1 Gag and flotation analyses were as described in Fig. 1. (A and B) Phase diagrams situate the DOPC and POPC mixtures tested relative to the Ld + Lo phase coexistence region. (A) The leftmost triangle crossing the low-Tm lipid axis represents a composition of low-Tm lipids DOPC/DOPS/cholesterol (40%/20%/40%). Each triangle moving sequentially to the right has an additional 5.7% DOPC replaced with 5.7% of the high-Tm lipid DSPC. The rightmost X symbol represents a composition of high-Tm lipids DSPC/DPPS/cholesterol (40%/20%/40%). Each X moving sequentially to the left has 5.7% DSPC replaced by 5.7% of the low-Tm DOPC. Note that the boundaries of the four-component phase diagrams containing PS have not been determined, but they are shown here based on the published three-component phase diagrams (19) to provide a guide to the expected phase behavior of the four-component PS-containing mixtures. (B) As in A, except with POPC lipids instead of DOPC lipids. The left starting point for the low-Tm lipids POPC/POPS/cholesterol (38%/30%/32%) is marked by a circle, with each sequential point having 5.4% POPC replaced by 5.4% of the high-Tm lipid DSPC. The right starting point for the high-Tm lipids DSPC/DPPS/cholesterol (38%/30%/32%) is marked by a dash, with each sequential point having 5.4% DSPC replaced with 5.4% of the low-Tm lipid POPC. All compositions yield a single phase (i.e., not coexistence of the two phases, Ld + Lo). Lipid order increases from the left to right (Ld to Lo) as the percentage of high-Tm lipid increases. (C and E) ESR and Gag binding measurements for the DOPC-containing liposomes. (D and F) ESR and Gag binding measurements for the POPC-containing liposomes. The symbols in C and D are the same as those in A and B. Error bars represent SD for at least three replicas for each data point.

