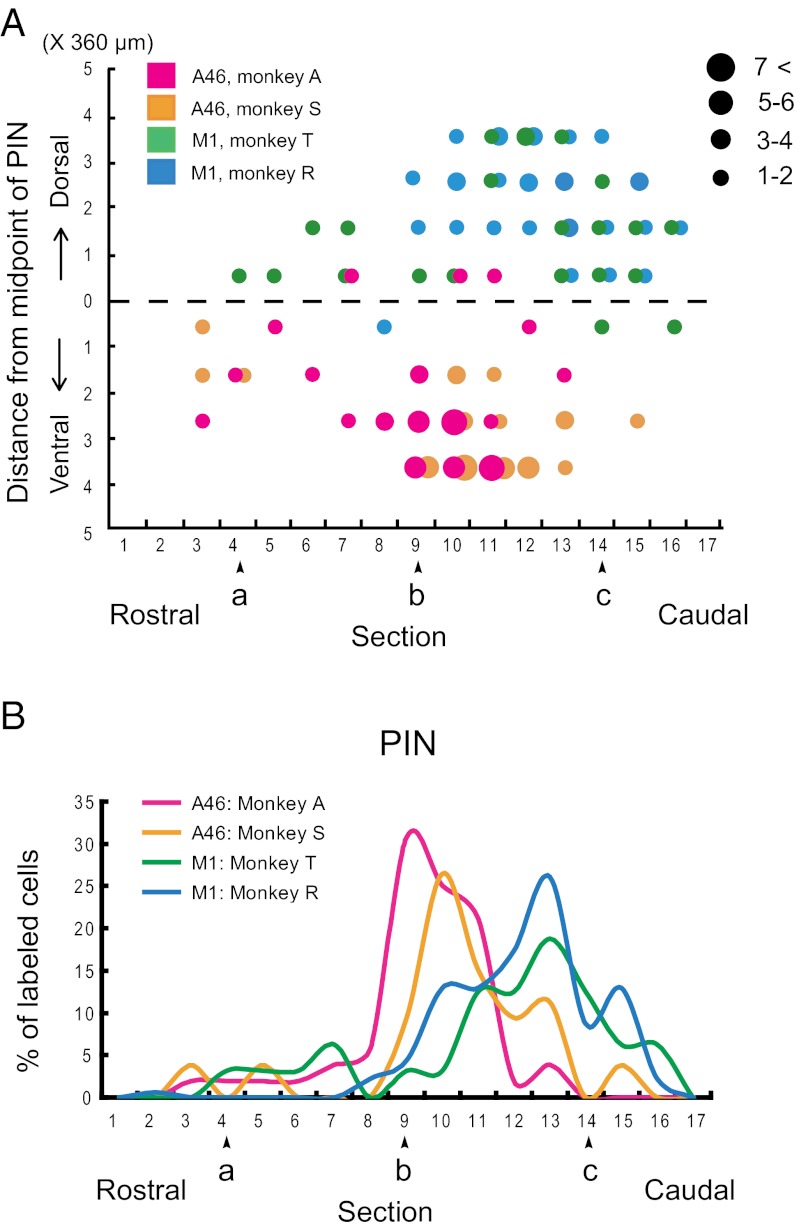
Fig. 4.
Distribution patterns of the PIN neurons labeled from area 46 versus the M1. (A) Dorsoventral extent of labeled neurons in the PIN. Purple and orange dots denote area 46 labeling in monkeys A and S, respectively. Blue and green dots denote the M1 labeling in monkeys T and R, respectively. Other conventions are as in Fig. 3. (B) Graphs showing the rostrocaudal extent of labeled neurons in the PIN. Purple and orange lines denote area 46 labeling in monkeys A and S, respectively. Blue and green lines denote the M1 labeling in monkeys T and R, respectively. Other conventions are as in Fig. 3.

