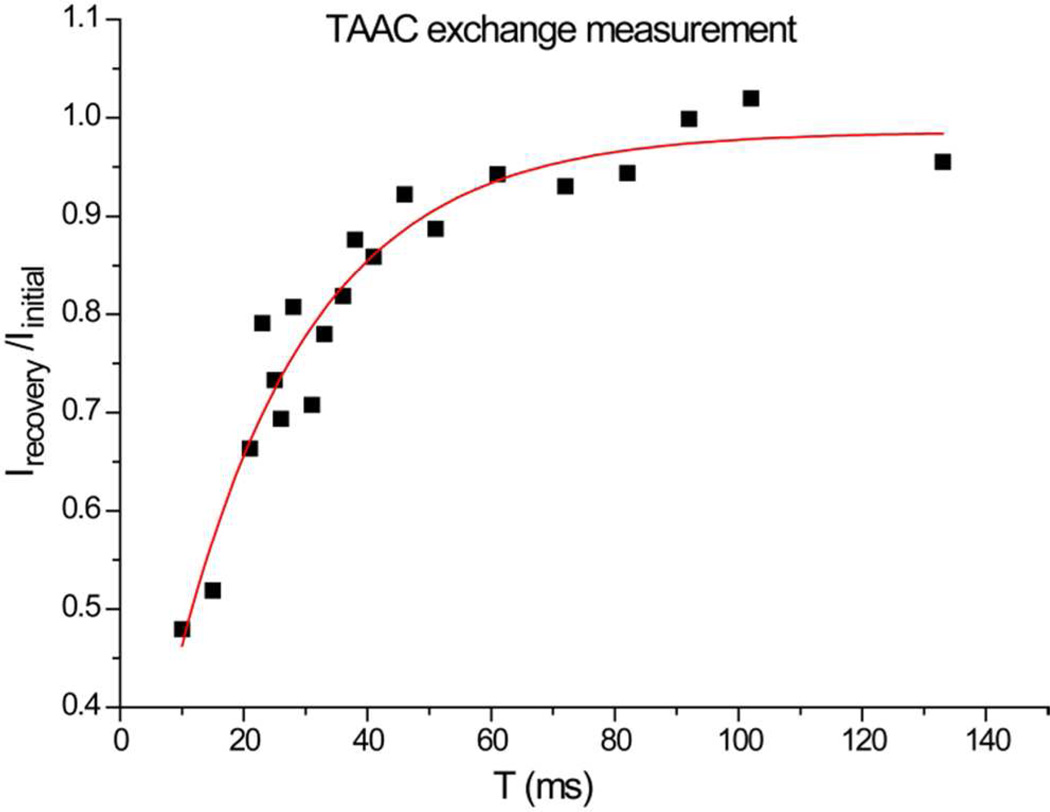
Figure 6.
Xe-TAAC exchange lifetime measurement by selective EXSY at 297 K. The horizontal axis denotes the mixing time between two consecutive excitations. The vertical axis indicates the ratio of the integrated intensities of Xe@TAAC signals, exchange recovered vs. equilibrium. Data were exponentially fitted to give an exchange lifetime, τexch = 22 ± 3 ms. This exchange lifetime is in good agreement with linewidth measurements made at 300 K (Table 1).

