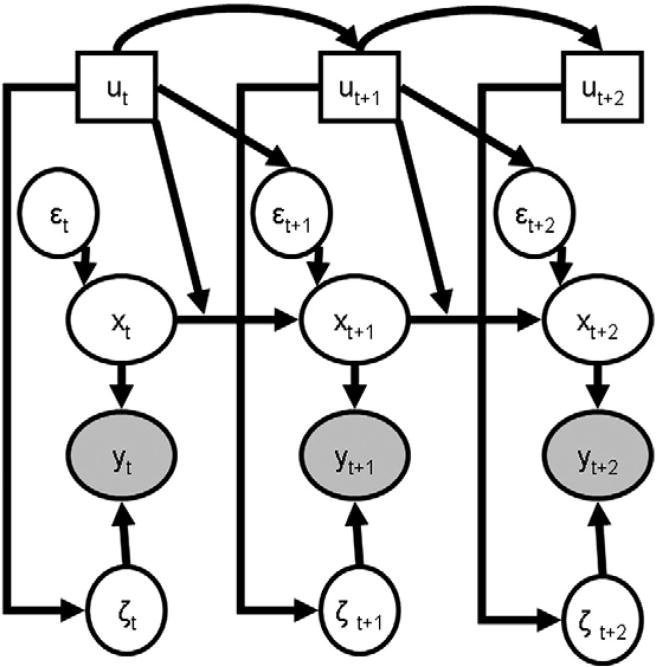
Fig. 2.
A schematic representation of the SLDS. In this diagram, ovals represent continuous-valued variables while boxes represent discrete valued variables. Filled nodes are observed while unfilled nodes are estimated. Arrows indicate directional dependency. In contrast to standard Bayesian network depictions, here we have drawn the arrow from ut to the connection between xt and xt+1 to emphasize the dependence of the connectivity on the cognitive state.

