
Figure 2.
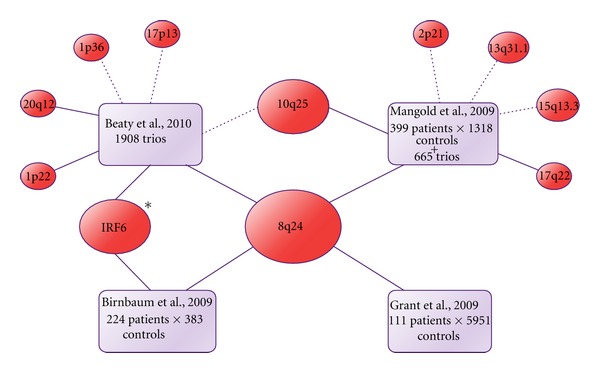
Diagram depicting the main lociassociated with NS CL ± P in the GWAS performed by Birnbaum et al. [72], Grant et al. [73], Mangold et al. [65], and Beaty et al. [64], which mixed case-control and trios (probands and their parents) approaches. Dotted lines represent borderline associations, whereas solid lines represent significant associations at the commonly accepted GWAS threshold (P < 10E − 7). (*) Mangold et al. [65] found evidence of interaction between IRF6 and GREM1, a gene located in 15q13.3 region, in NS CL ± P susceptibility.