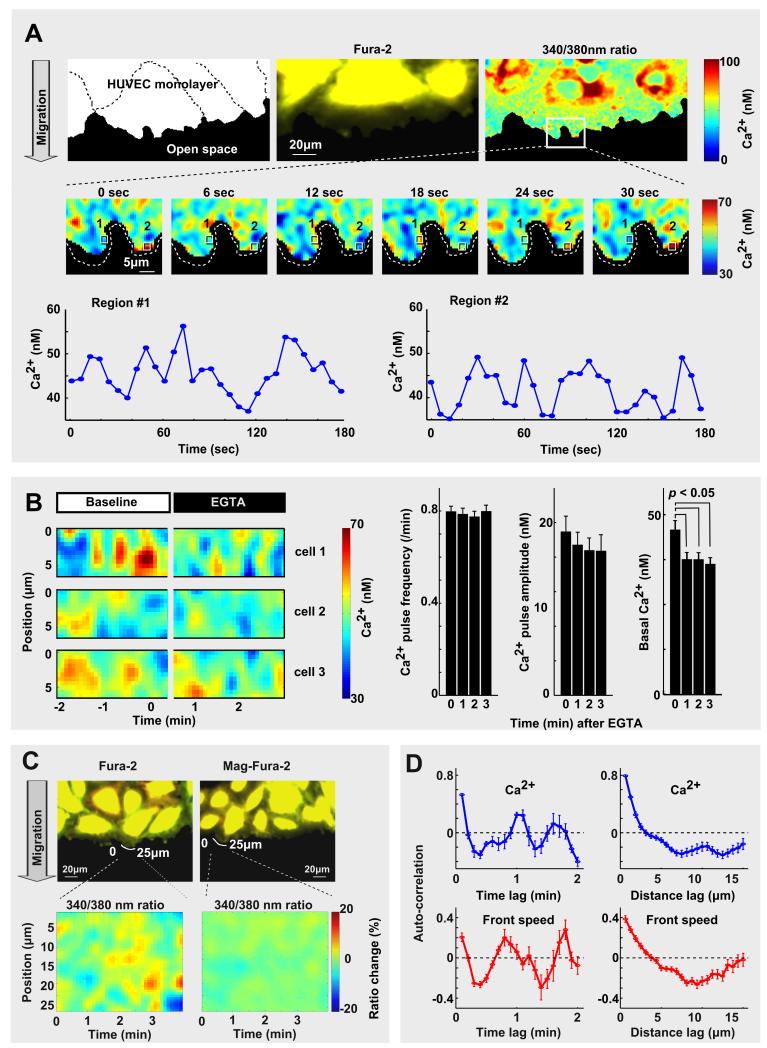
Figure 1. Identification of Ca2+ release pulses and local lamellipodia protrusion-retraction cycles at the leading edge of migrating endothelial cells.
(A) Local Ca2+ pulses close to the front of migrating HUVEC cells. Time series analysis showing ratio-images of the Ca2+ indicator Fura-2. Note the temporal changes of local Ca2+ in the marked regions. (B) Ca2+ pulses are primarily a result of Ca2+ release from internal Ca2+ stores. (left) Ca2+ pulses continued after external Ca2+ was removed by adding the chelator EGTA. (right) Bar graphs of frequency, amplitude, and basal level of Ca2+, before and after 2mM EGTA addition (N = 24). (C) Control experiment excludes motion artifacts in the Ca2+ measurements. Ratio-images of Mag-Fura-2 did not show the same intensity changes (Mag-Fura-2 does not change its intensity for small Ca2+ changes). (D) Example of a single cell spatial and temporal auto-correlation analysis of Ca2+ pulses (upper panel) and leading edge speed (lower panel). Data are mean ± standard error of the mean (s.e.).

