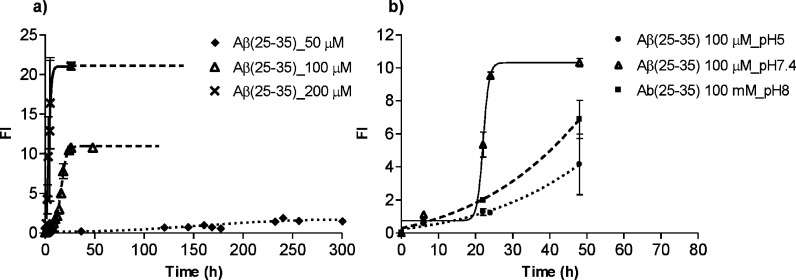
Figure 4.
Effect of peptide concentration and pH on Aβ(25–35) aggregation: ThT fluorescence profile. (a) Aβ(25–35) (50, 100, and 200 μM) was incubated in phosphate buffer (34.5 μM, pH 7.4), with 17.5% of acetonitrile at 4 °C; (b) Aβ(25–35) (100 μM) was incubated in phosphate buffer (34.5 μM, pH 5, 7.4 and 8), with 17.5% of acetonitrile at 4 °C.

