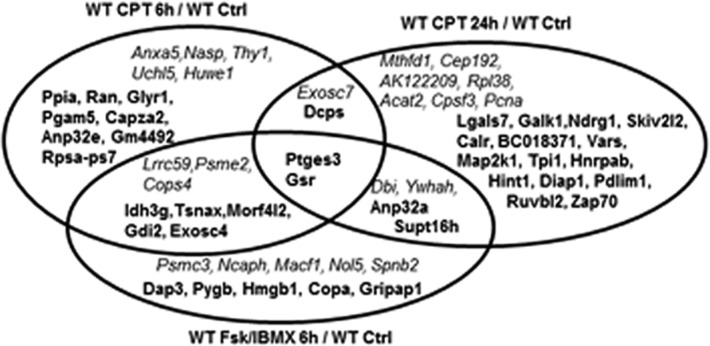
Figure 3.
Proteins with changes in expression in WT S49 cells incubated with CPT-cAMP, or IBMX with Fsk. The diagram shows the proteins that have significant changes in WT cells incubated for 6 h with CPT-cAMP, or Fsk with IBMX, or for 24 h with CPT-cAMP. The names of proteins whose levels of expression increased are shown in bold, and the names of proteins whose levels of expression decreased are shown in italics.

