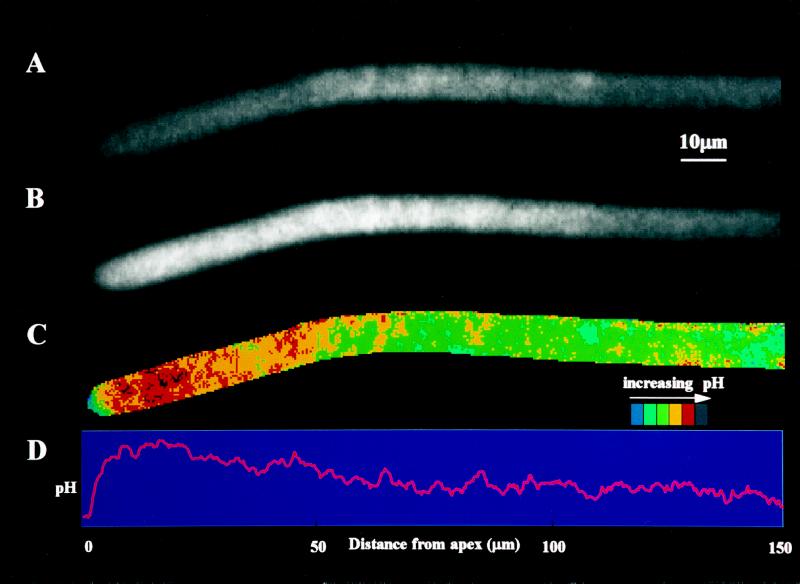
Figure 1.
Intracellular pH distribution within a growing germ tube of G. margarita loaded with the pH indicator BCECF and measured by fluorescence ratio imaging. A, Fluorescence image at 450 nm excitation. B, Same fluorescence image at 490 nm excitation. C, Ratio of the two previous images (490/450 nm) as a pseudocolor image showing the pH variations along the hypha. D, Same ratio image representing the average pixel values along the length of the hypha; these values are proportional to pH values.

