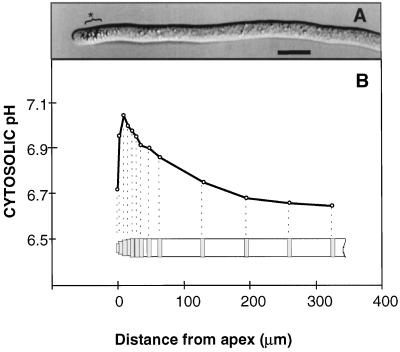
Figure 3.
G. margarita germ tubes. A, Image obtained by differential interference contrast microscopy. Bar = 10 μm. A group of unidentified organelles is indicated (*). B, Typical pH profile along the hyphal trunk: dotted lines show corresponding selected photometric reading windows for measurement of the fluorescence emitted by the pH indicator BCECF.

