Figure 5.
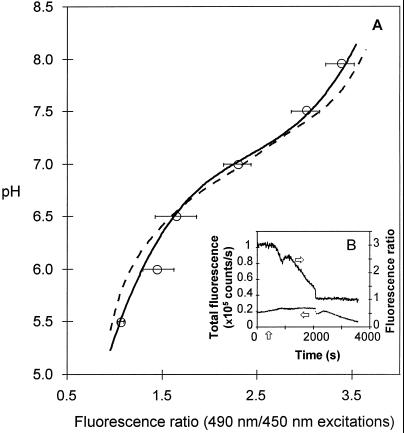
Fluorescence signal calibration. A, pH-calibration curves. In vitro calibration showing measurements of fluorescence ratios (for 490- and 450-nm excitations) of 1 μm BCECF in sodium phosphate buffer at various pH values (dotted lines) and in vivo calibration showing the same fluorescence ratios measured in G. margarita germ tubes (solid lines) at varying external pH values in the presence of 1 μm BCECF-AM, 90 μm potassium chloride, and 4.4 μm nigericin. Values are means (n = 4–6) (○), with corresponding se bars. Both calibration curves were calculated under polynomial fitting (order 4) from measured data ratios. B, Real-time cell reaction (25 μm from the hyphal tip) of G. margarita loaded with BCECF to nigericin/potassium addition after 300 s (vertical arrow) at external pH 5.0. The fluorescence ratios (right y axis) for 490-/450-nm excitations and total fluorescence (left y axis) at 450-nm excitation are given. Horizontal arrows indicate the corresponding axes of the two curves.

