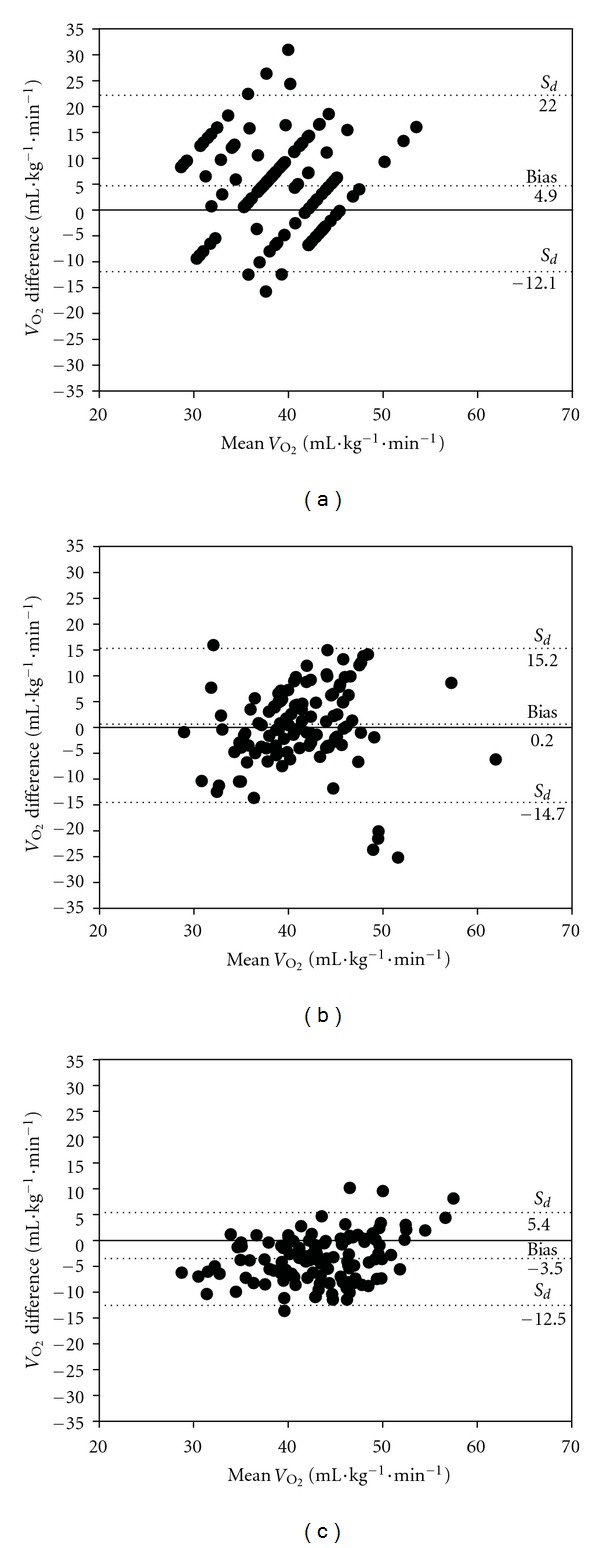
Figure 2.

Bland-Altman plot for the individual differences between V O2max assessed in CPET1 and V O2max estimated by VSAQ (a), RPC (b), and CRF (c). The first and third horizontal dashed lines in each graph represent the 95% limits of agreement for VSAQ, RPC, CRF, and VSAQ, corresponding, respectively, to −12.1 to 22.0 (−29.1 to 53.0%); −14.7 to 15.2 (−35.5 to 36.6%); −12.5 to 5.4 (−30,0% to 13,0%). S d: standard deviation of the differences.
