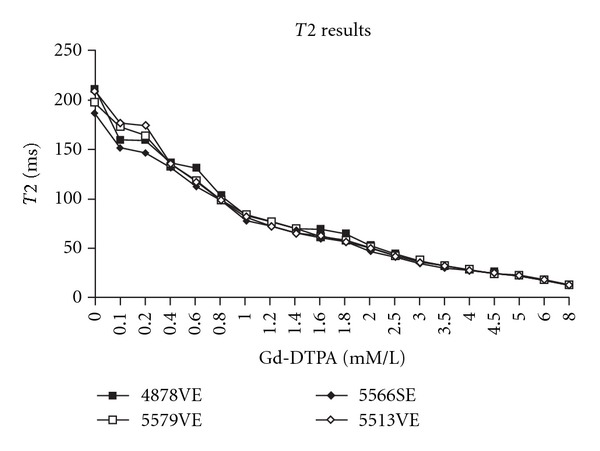
Figure 2.

Calculated T2 values versus Gd-DTPA concentration for several experimental runs. The individual runs, rather than the averaged values, are shown to stress that the curves follow the same pattern of decreasing T2 with increasing gadolinium concentrations in a fairly smooth form. Values of T2 are obtained from a least squares fit of (3) (Section 2).
