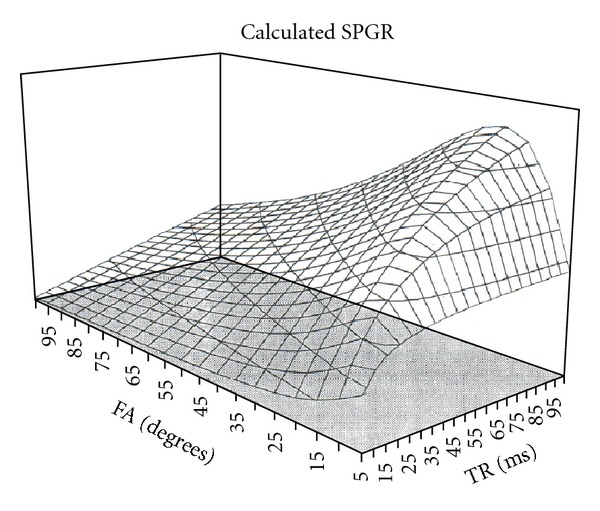
Figure 5.

A manifold showing calculated SPGR signal using (5) as a function of TR and FA. For each value of TR, there is a corresponding FA which maximizes expected signal. It turns out that the sequence parameters which maximize SPGR signal are not the ones that give the most accurate signal-concentration curves (see Section 4).
