
Figure 1.
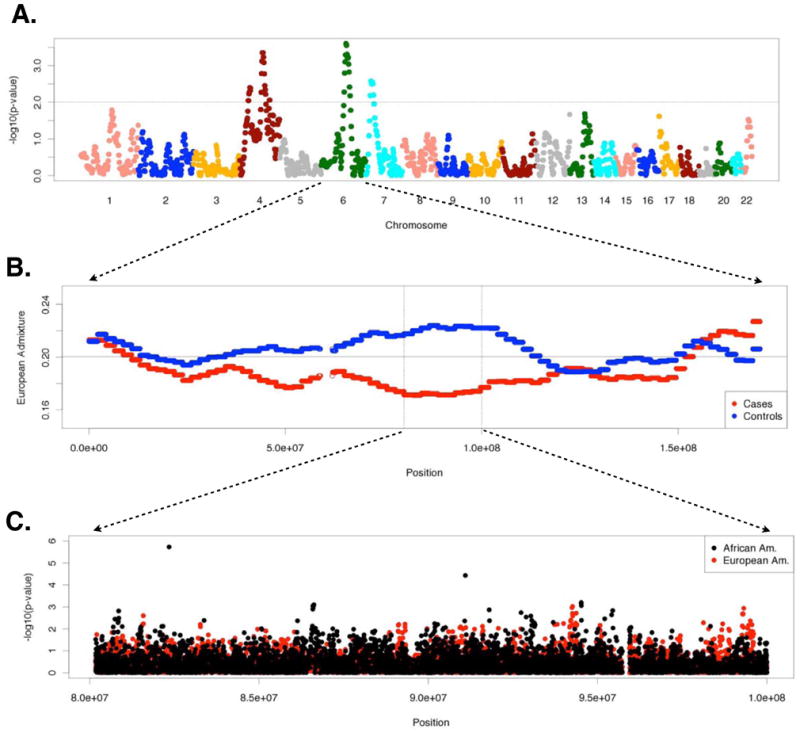
Results of genome-wide ancestry and allelic association testing in African American adults with asthma and healthy controls using logistic regression. A. −log10 (p-values) across the genome showing the location of four ancestry association peaks with p-values < 0.01 (above the dashed line). B. Average local European ancestry in the cases (red) and controls (blue) on chromosome 6; vertical lines indicate the boundaries of the ancestry association peak with p<0.01, and the horizontal line indicates local European ancestry averaged across the genome. C. Tests of allelic association within the ancestry association peak on 6q in African Americans (using local ancestry as a covariate) and European Americans in CSGA/SARP.