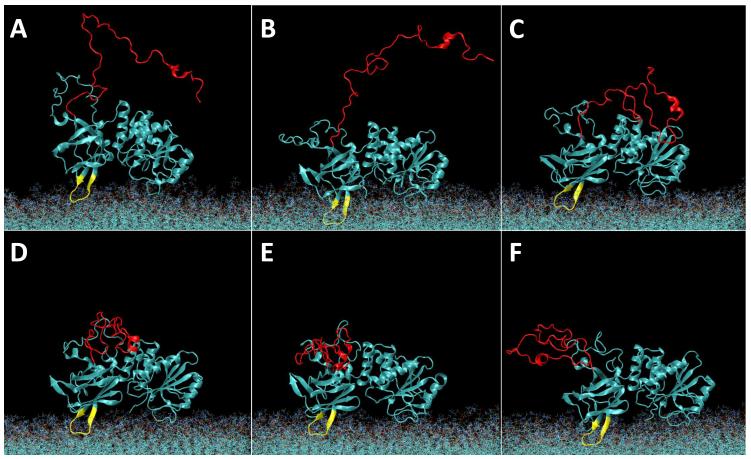
Figure 3.
Evolution of the wt PTEN structure on a PC/PS (2:1) membrane in the course of the MD simulation. Water molecules are omitted for clarity. The initial snapshot (A) at t = 0 shows the starting configuration of PTEN with its core domains oriented with respect to the plane of the bilayer as suggested from the crystal structure (Lee et al., 1999) and placed ca. 10 Å further away from the membrane surface than in the equilibrated state. The disordered protein trains (in particular, PTEN’s C-terminal tail, indicated in red) were initialized in an artificially extended conformation taken from a Monte-Carlo simulation. The CBR3 loop on the C2 domain is shown in yellow. Subsequent panels show equidistant snapshots at t = (B) 55 ns, (C) 110 ns, (D) 165 ns, (E) 220 ns and (F) 275 ns.

