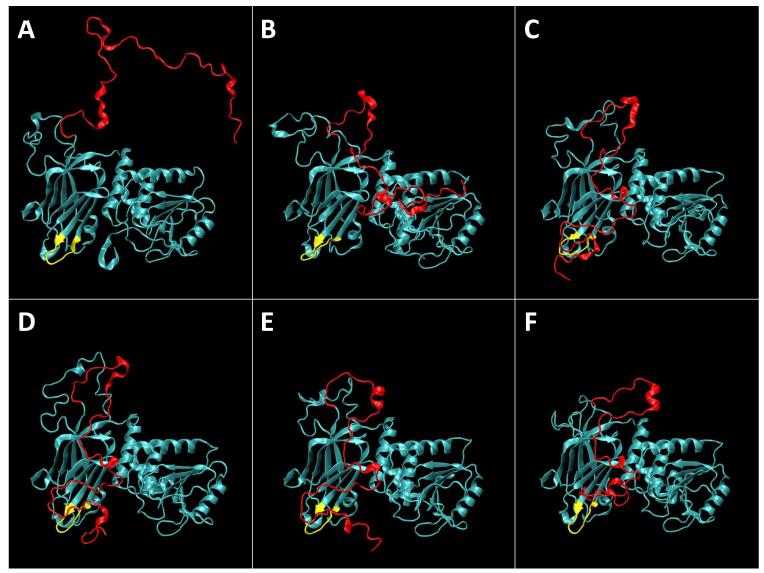
Figure 7.
Evolution of the wt PTEN structure in solution in the course of the MD simulation. Water molecules are omitted for clarity. The initial snapshot (A) at t = 0 shows the starting configuration. The disordered protein trains (in particular, the C-terminal tail, indicated in red) were initialized in an artificially extended conformation taken from a Monte-Carlo simulation. The CBR3 loop on the C2 domain is shown in yellow. Subsequent panels show equidistant snapshots at t = (B) 70 ns, (C) 140 ns, (D) 210 ns, (E) 280 ns and (F) 350 ns.

