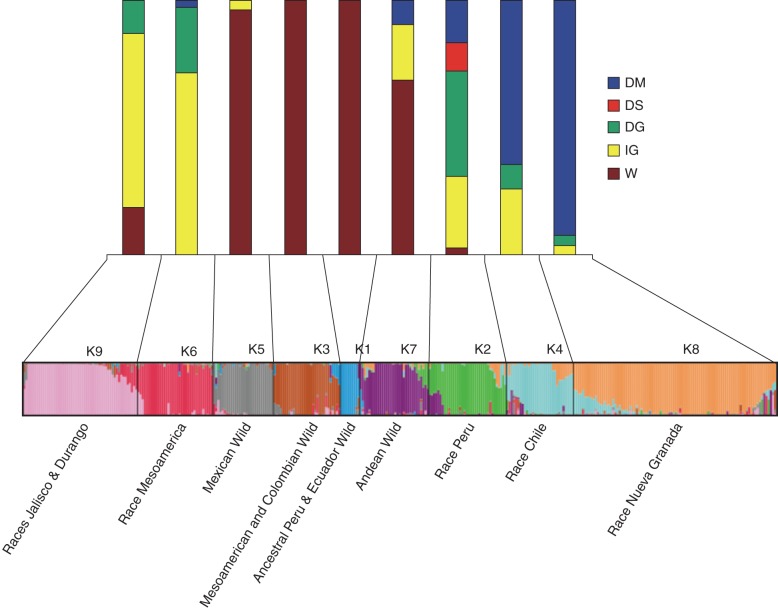
Fig. 3.
The distribution of determinacy in each sub-population (K1–K9) as identified by STRUCTURE (Kwak and Gepts, 2009). The lower part of the figure represents a STRUCTURE bar graph of wild and domesticated bean simple sequence repeat diversity according to Kwak and Gepts (2009). The upper part of the figure represents the proportion of four classes of bean accessions based on status (wild vs. domesticated), growth habit (determinate vs. indeterminate) and presence or absence of a retrotransposon insertion in the PvTFL1y locus: DM, domesticated, determinate, retrotransposon insertion into PvTFL1y region; DS, domesticated, determinate, deletion of whole PvTFL1y region; DG, domesticated, determinate, wild-type PvTFL1y region; IG, domesticated, indeterminate, wild-type PvTFL1y region; W, wild, indeterminate, wild-type PvTFL1y region.

